RentOk Release Note - 18th May, 2026
Hello!
This week, we are thrilled to unveil a completely redesigned Home Dashboard for both web and mobile. Based on your feedback, we've transformed the home page into a powerful, personalized, and single source of truth for your property's health.
Introducing Your New Home Dashboard - All Your Key Metrics in One Place
We've revamped the entire home page to give you a clear, actionable overview of your property's performance the moment you log in. It's designed to help you focus on what truly matters, and every single data point on the new dashboard acts as a direct shortcut.
See what’s new →
Highlights
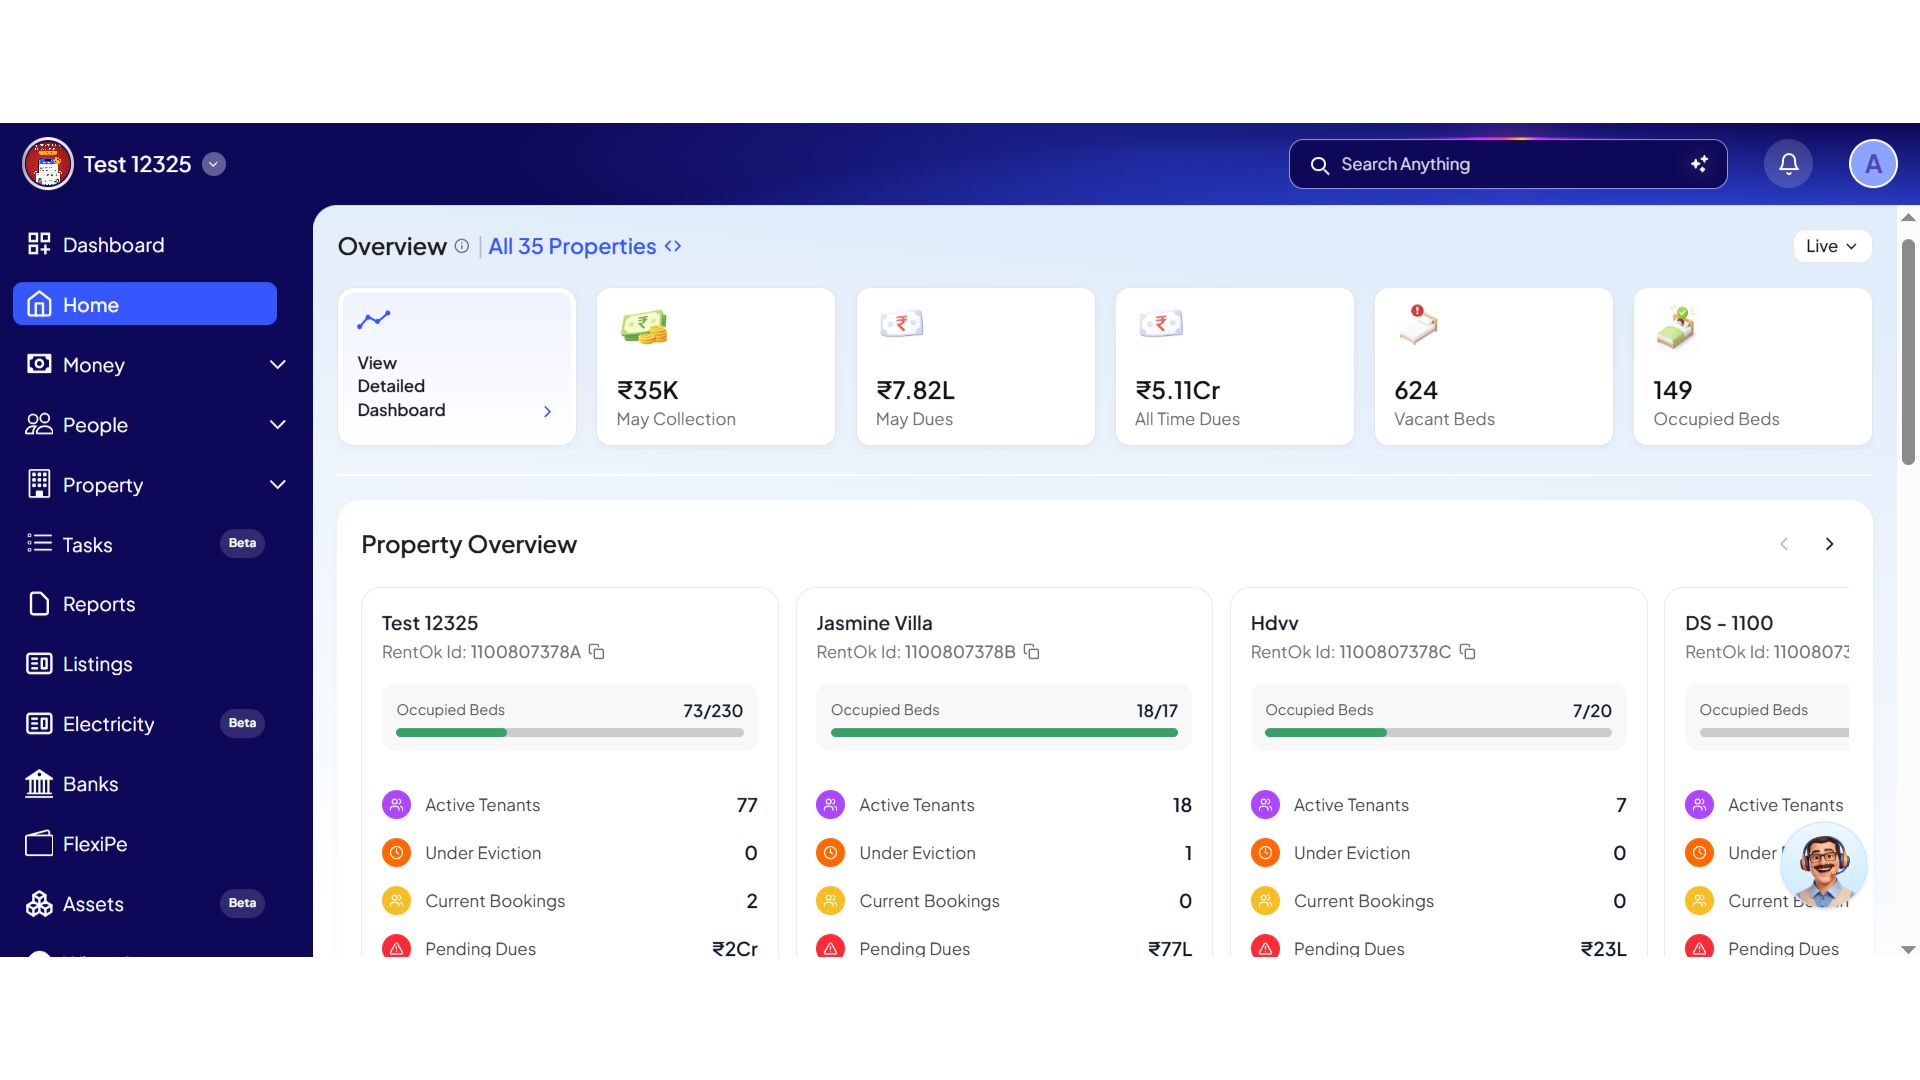
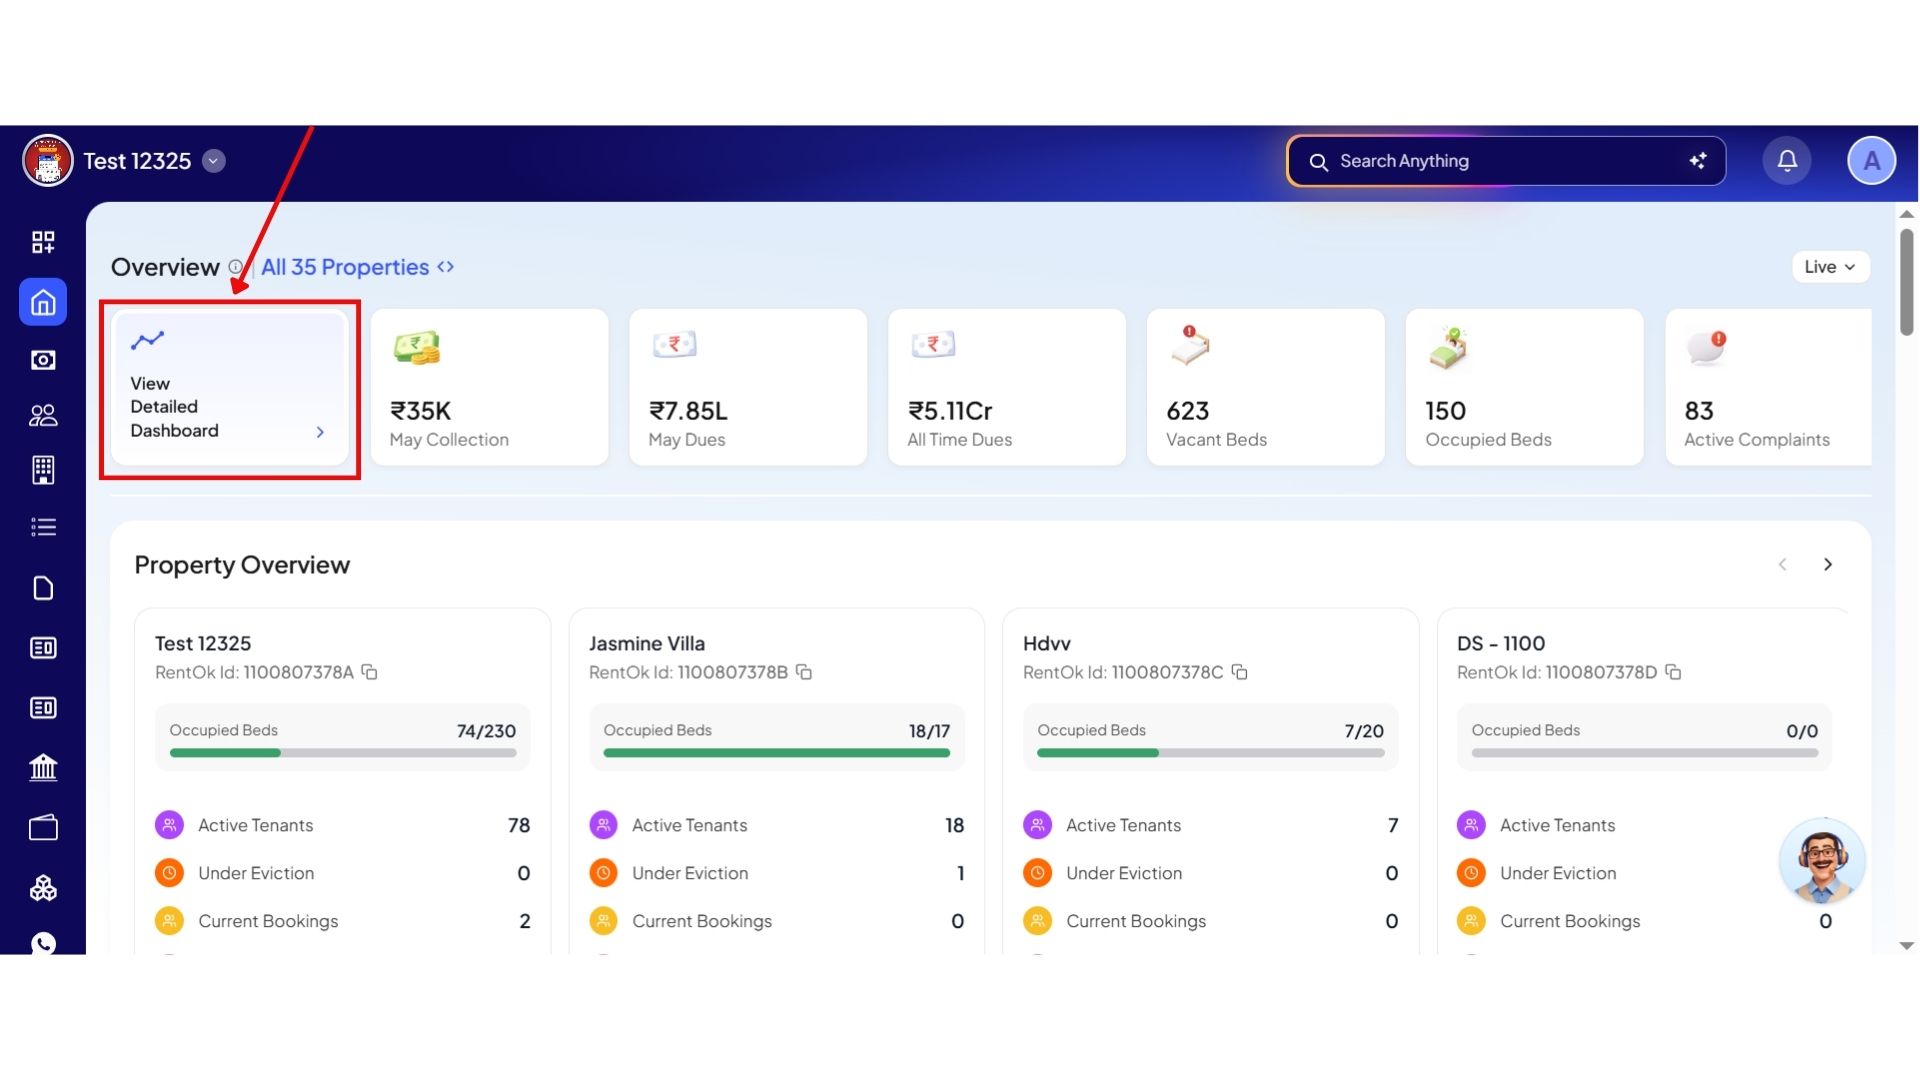
- Key Metrics at a Glance: The top of the screen now shows the six most important numbers: This Month's Collection, This Month's Dues, Total Pending Dues, Total Vacancy, Occupancy Rate, and Active Complaints.
- Detailed Analytics Dashboard: A new "View detailed dashboard" button opens a dedicated page with in-depth analysis of your finances, occupancy, and tenant data across all properties.
- Actionable Pending Tasks: A new section highlights critical tasks that need your attention, like pending agreement renewals or updating the food menu, allowing you to act on them directly.
- Visual Charts: Quickly understand your property's health with new interactive charts for Occupancy, Financials, Tenant Journey (Leads, Bookings, Tenants), and Issues.

Financial Breakdowns & Deep Drill-Downs
Headline collections and outstanding balances are now broken down right on the primary card face. This prevents misleading totals and gives you full itemized context without running reports.
Highlights
- Triple-Parsed Dues Breakup: Headline figures (e.g., ₹10L total dues) are instantly broken down into Already Overdue (active tenants), Due Today, and Bookings Dues (advance tokens from prospective tenants).
- Nested Accordion Layouts: View top financial items for your selected time period, with smaller items cleanly packed into an Others row.
- Liability Split: Track deposits broken out cleanly across past tenants, active tenants, and advance bookings.
How to try
- Step 1: Log in to the Web App
Open the web version of the app and enter your login credentials. Once logged in, you will be taken to the Dashboard.

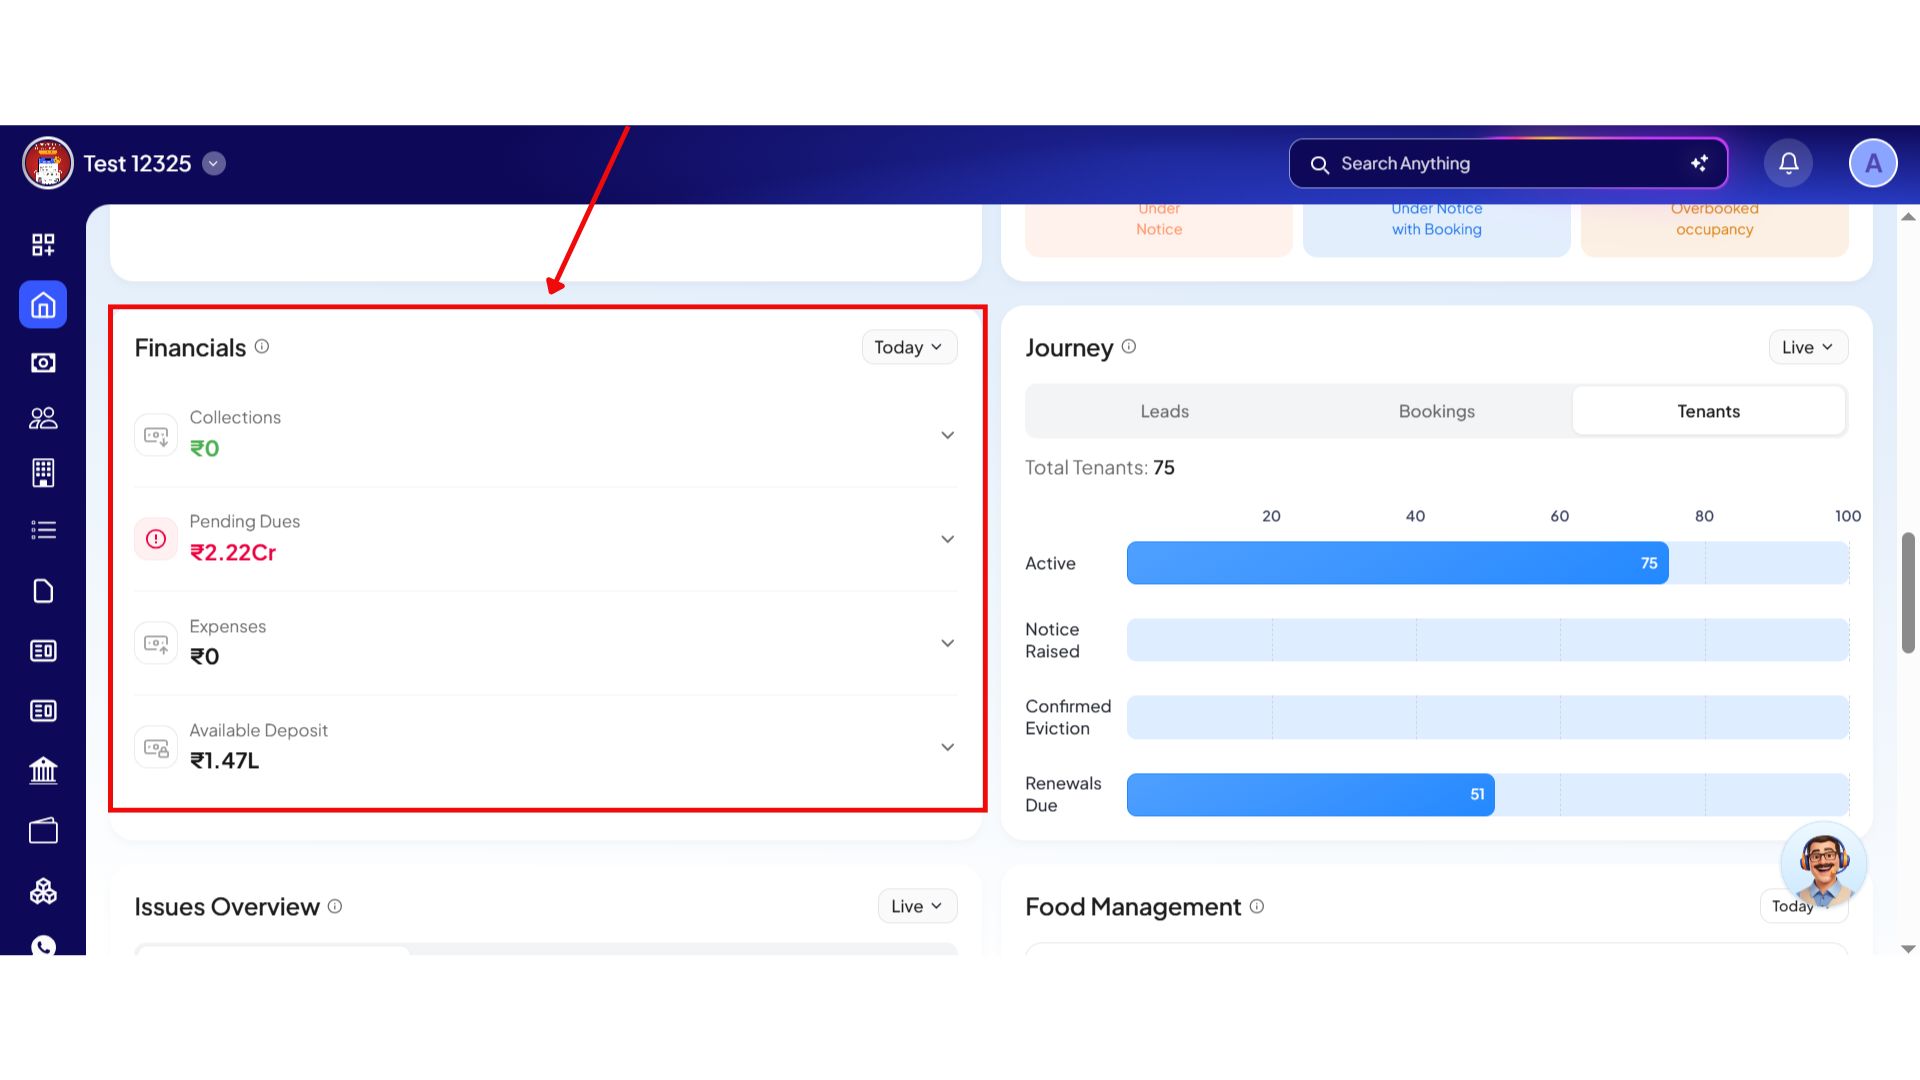
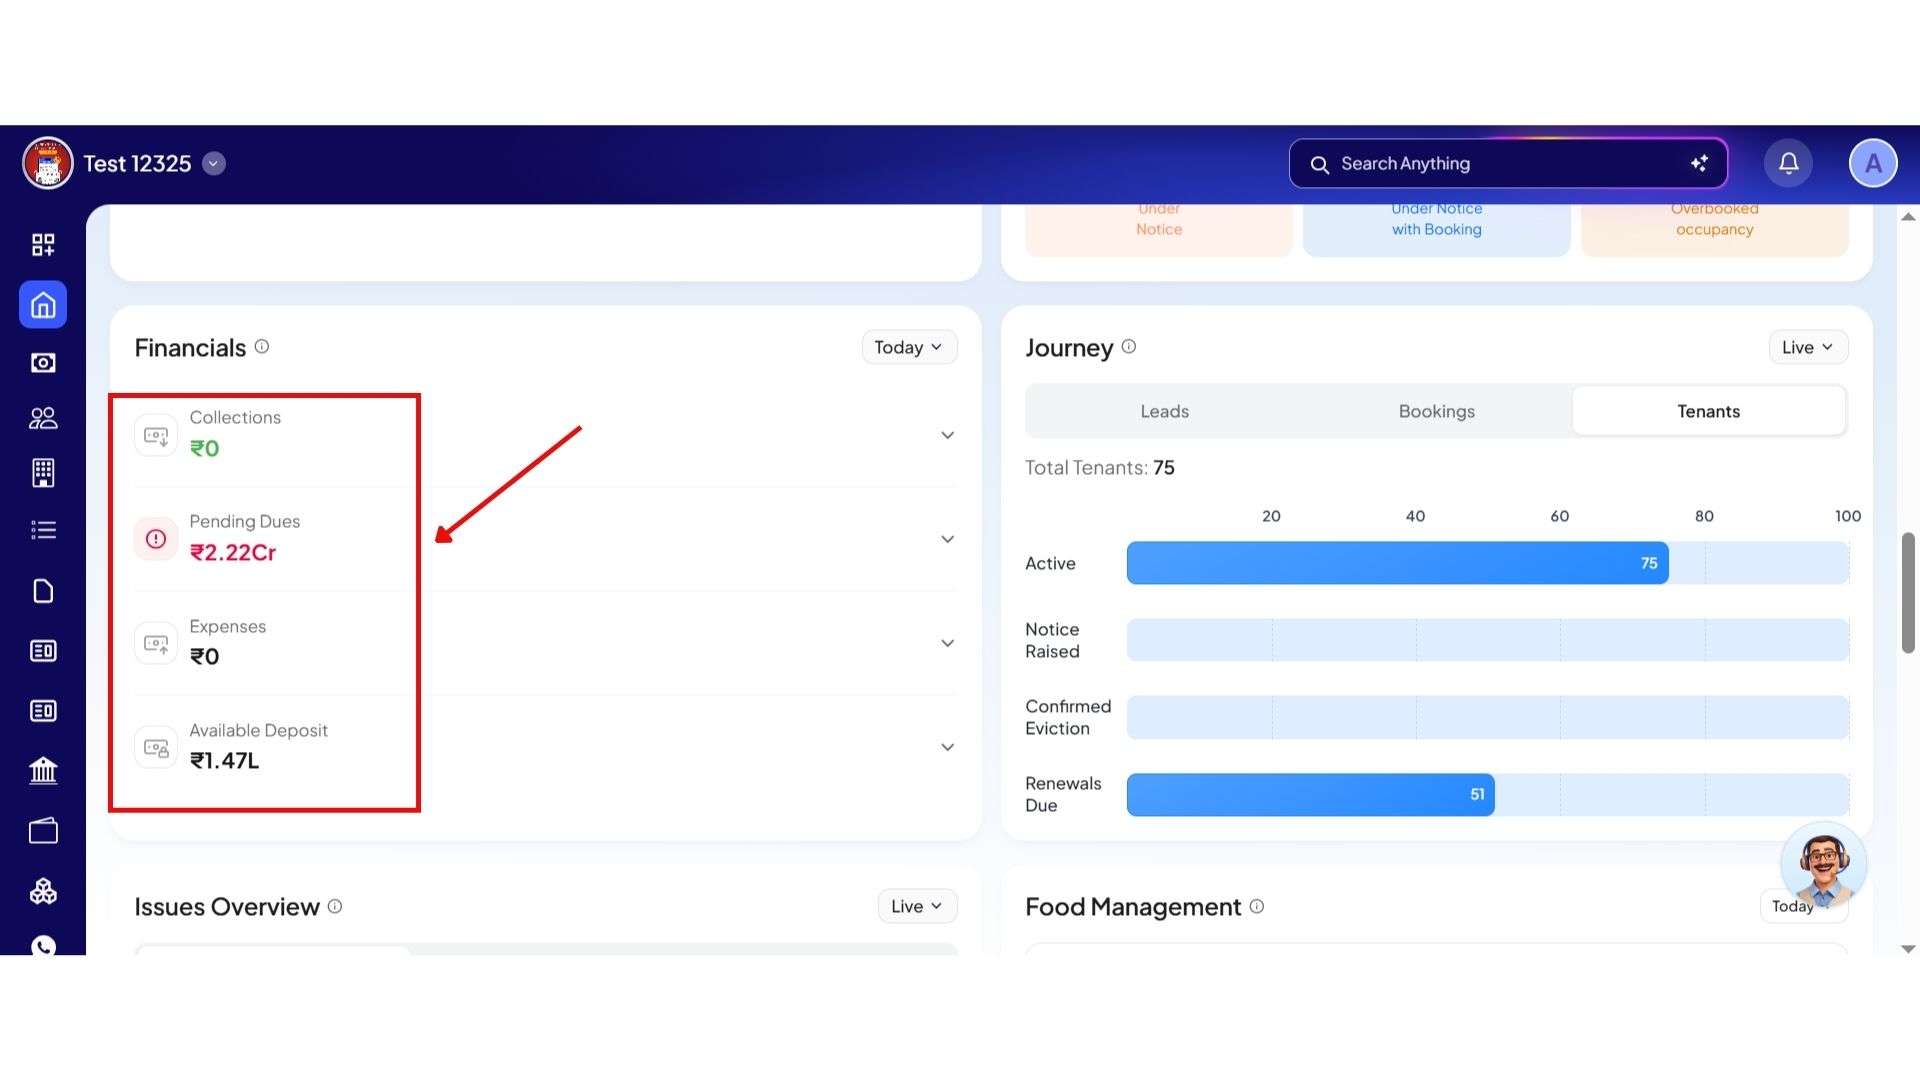
- Step 2: Open the Financials Section
On the Dashboard, scroll down until you see the Financials box. This section gives you a quick summary of your financial data at a glance.
- Step 3: View Financial Categories
Inside the Financials section, you will see four main categories:
- Collections
- Pending Dues
- Expenses
- Available Deposit
These sections help you quickly understand the overall financial status of your property.
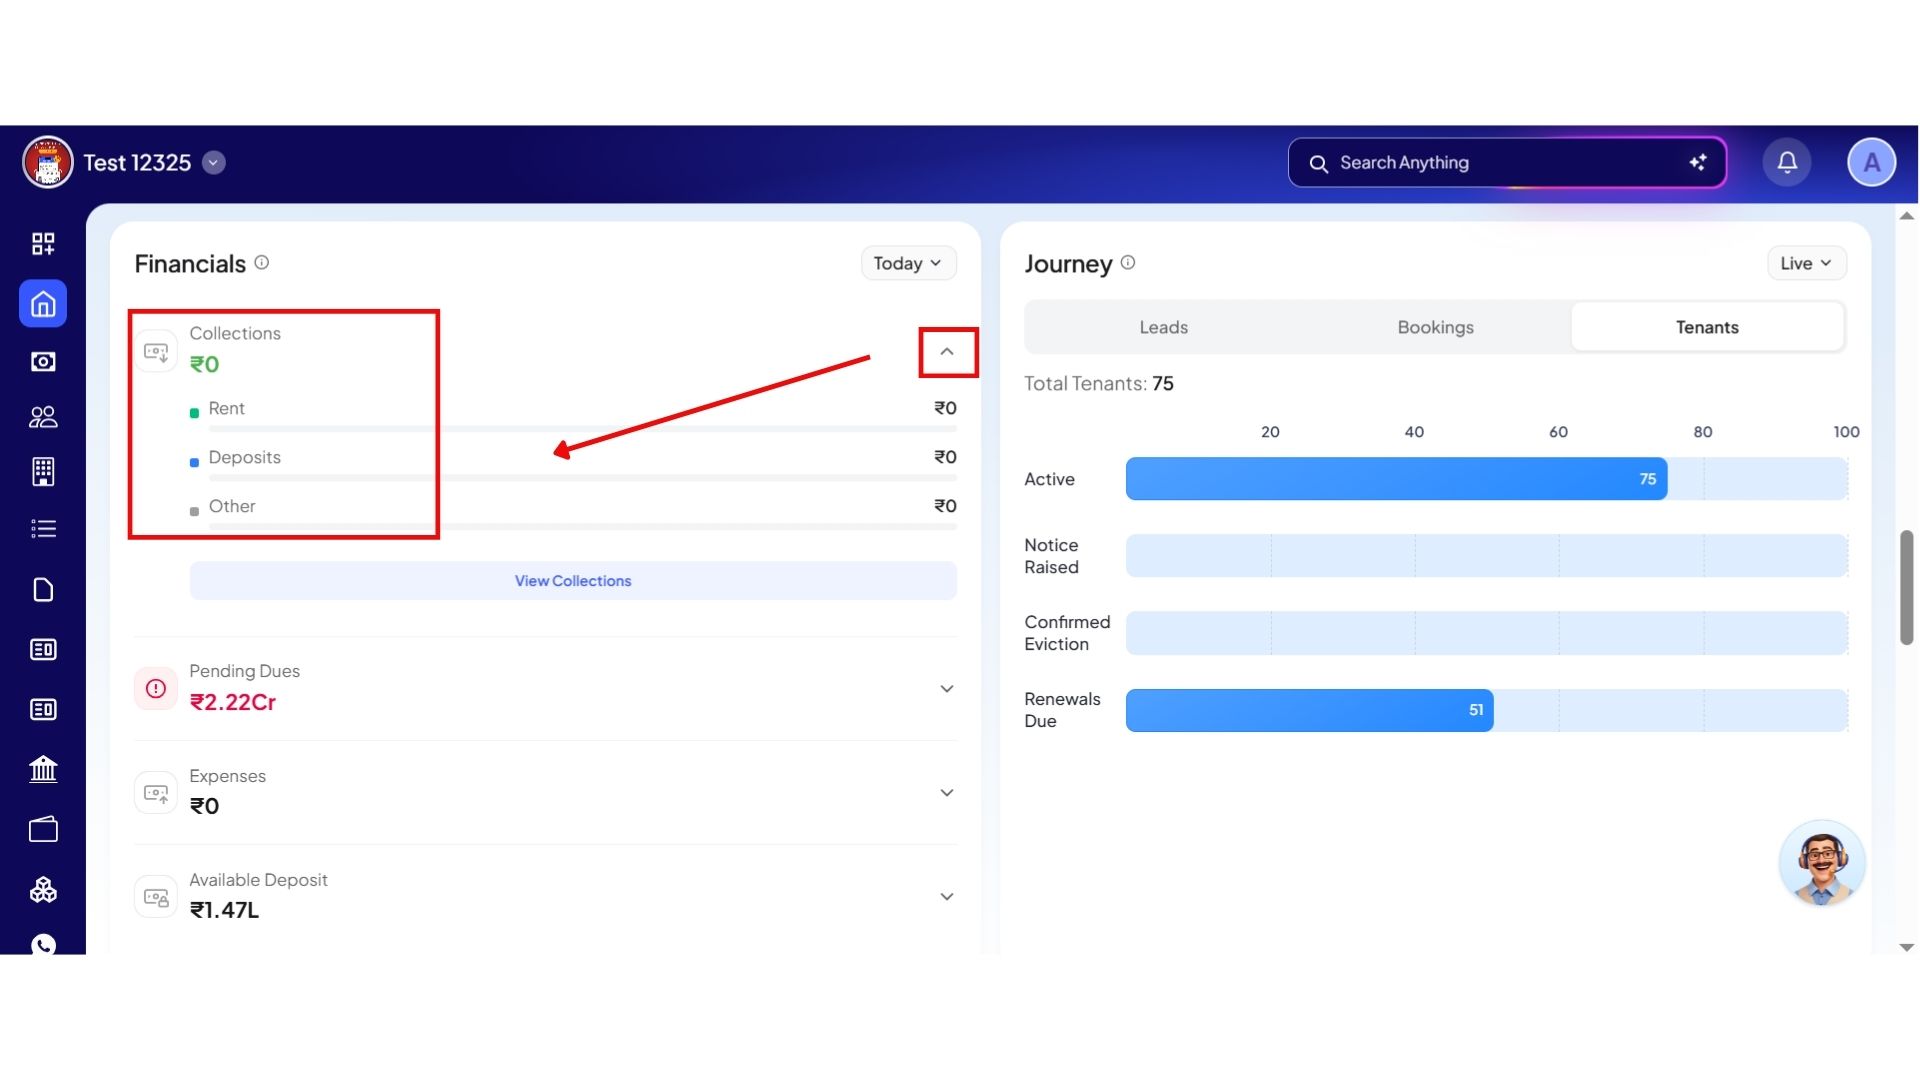
- Step 4: Expand a Section for More Details
Click on the arrow icon next to any section to expand it. Once expanded, you will see a breakdown of the main components inside that category.
- For example, under Collections, you may see categories like:
\- Rent

\- Deposit

\- Other collections
- Step 5: Open Detailed Financial Pages
If you click on any of the categories, the system will redirect you to the detailed page for that section. There, you can view complete information, records, and financial details related to that category.
💡 Why it matters: This prevents owners from panicking over high headline dues that are actually just advance tokens from unconverted bookings. It isolates actual overdue rent instantly, so you know exactly who to collect from.
Occupancy Health Tracker (Units vs. Beds View)
Checking property vacancy is now a surface-level visual check. We have introduced an instant toggle system to accommodate different business layout styles on a single card.
Highlights
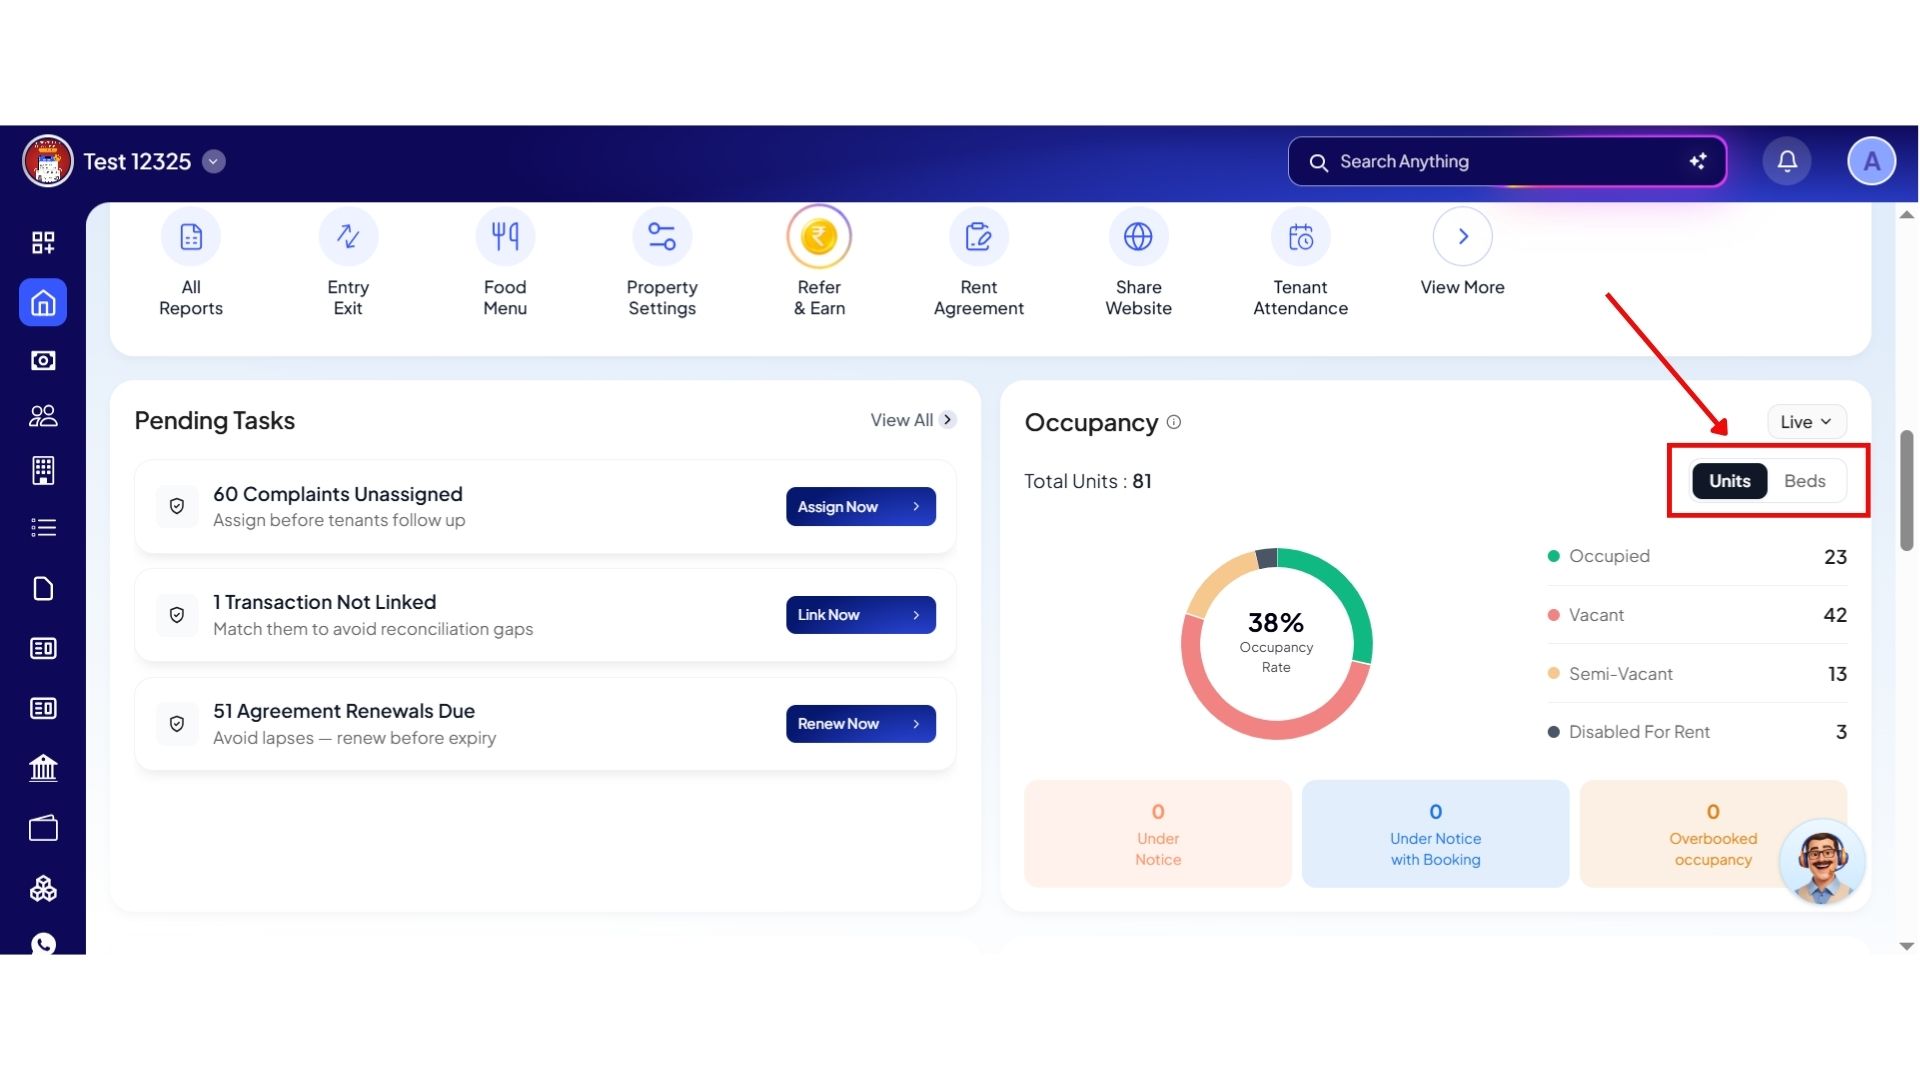
- Dual Lens Toggling: Easily swap views depending on your property layout models.
- Unit View: Optimized for flat and apartment models tracking independent room statuses.
- Bed View: Tailored for PG (Paying Guest) and co-living operations tracking specific bed allotments.
- Real-time Color Charts: View live occupancy percentages instantly via a round visual graph right on the card.
How to try
- Step 1: Log in to the Web App
Open the web version of the app and enter your login credentials. Once logged in, you will be taken to the Dashboard.

- Step 2: Open the Occupancy Section
On the Dashboard, scroll down until you see the Occupancy section. This section provides a detailed overview of your property occupancy status.
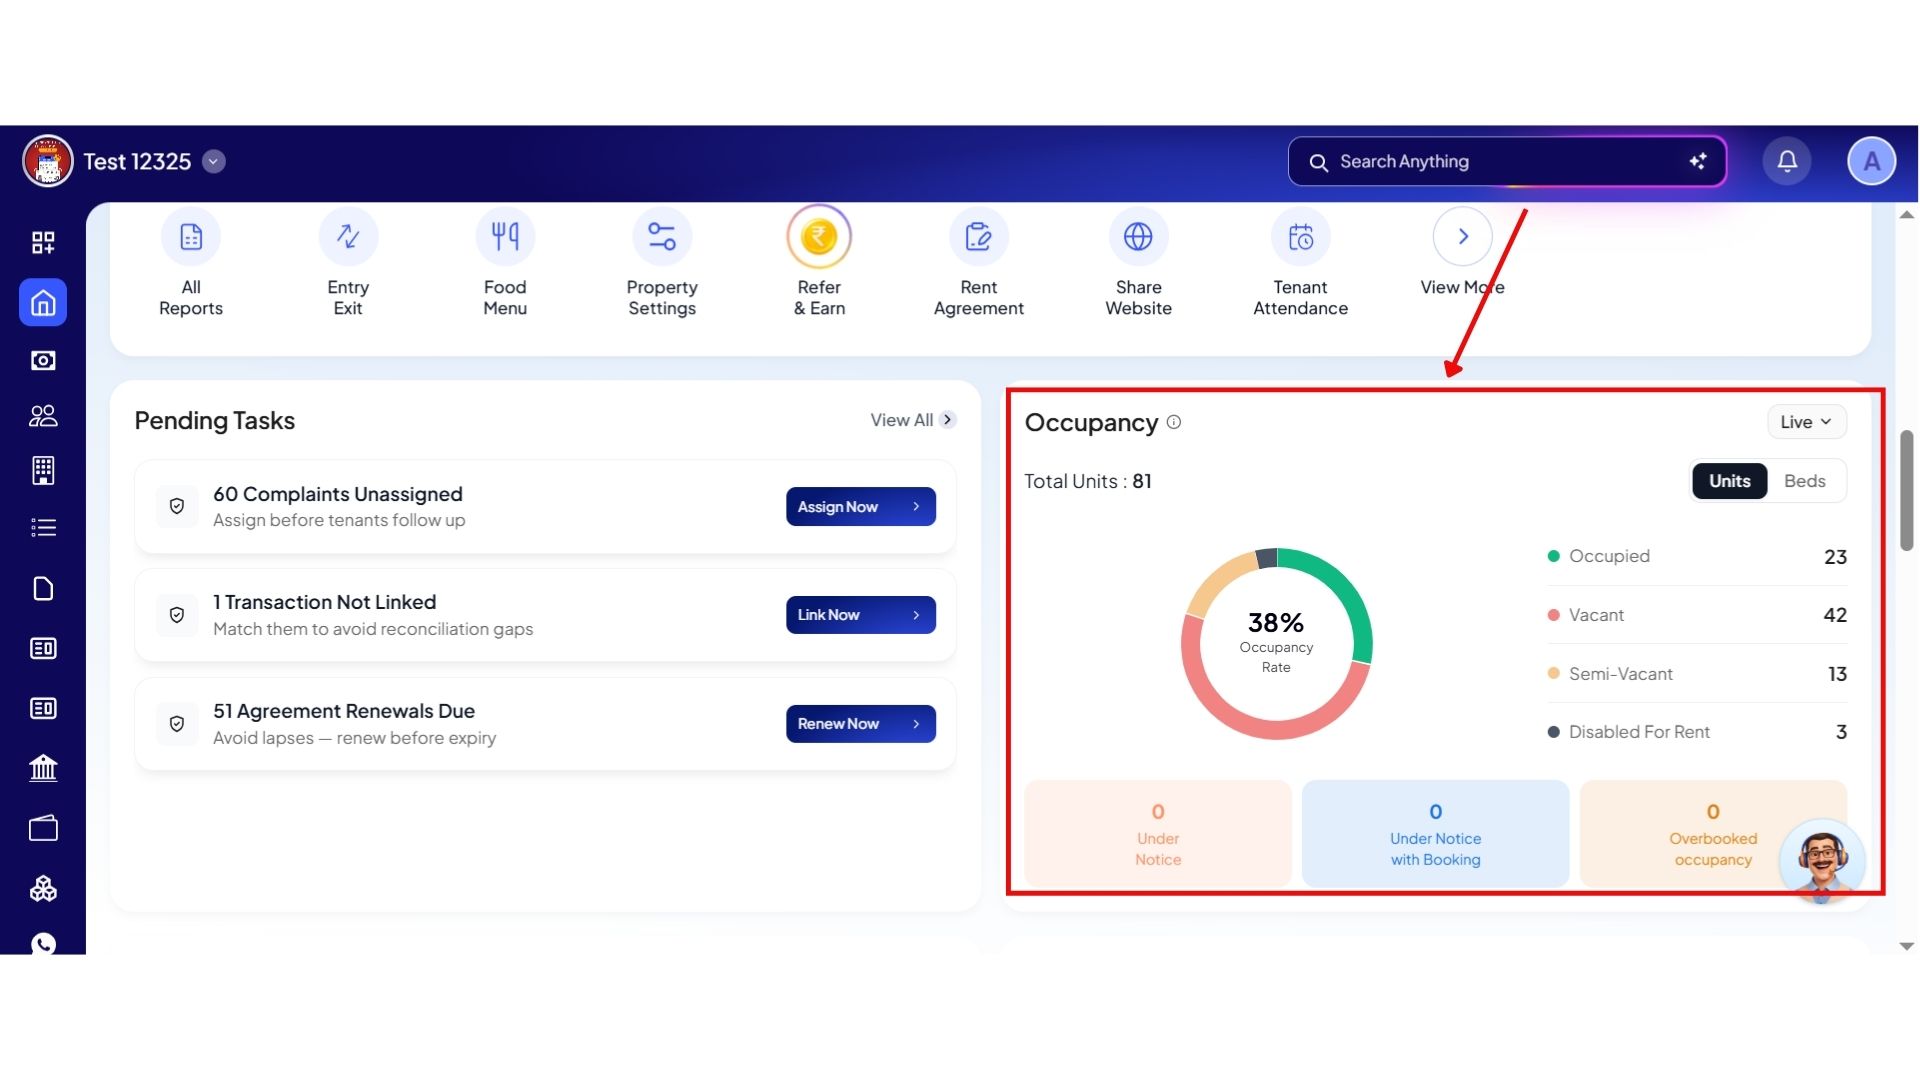
- Step 3: View Unit Occupancy Details
Inside this section, you will be able to see different occupancy categories for your units, such as:
- Total Units
- Occupied Units
- Vacant Units
- Semi-Vacant Units
- Disabled for Rent
- Under Notice
- Under Notice with Booking
- Overbooked Occupancy
This helps you understand the current status of all your units at a glance.
- Step 4: Switch Between Units and Beds
You can also view occupancy details separately for both Units and Beds. This allows you to track occupancy more accurately based on your property setup.
💡 Why it matters: This removes the old requirement of pulling room status matrices or manually calculating bed versus room counts. You get a direct, true visual of your true inventory health in one second.
One-Tap Detail View (Frictionless Drill-Down Navigation)
We have completely eliminated filter fatigue. Instead of setting up complex search metrics to investigate a number, every single data point on the new dashboard acts as a direct shortcut.
Highlights
- Zero Manual Filtering: Touch any specific number on any home screen card to instantly view its underlying details.
- Pre-Applied Configurations: The system automatically filters the inner list to match your exact selection.
How to try
- Step 1: Log in to the Web App
Open the web version of the app and enter your login credentials. Once logged in, you will be taken to the Dashboard.


- Step 2: Explore Dashboard Widgets
On the Dashboard, you will see different sections and widgets showing important updates, summaries, and shortcuts related to your property management activities.
- Step 3: Open Any Section Directly
You can click on any widget to directly open the linked page for that section.
For example:
- Clicking on Food Management will take you to the food settings section where you can manage meals and menus.
- Clicking on Pending Tasks will redirect you to the complaints section for further action.
💡 Why it matters: What used to take staff 2–3 minutes of generating reports, or took landlords 5+ minutes of adjusting filter dropdowns, now takes exactly one tap.
Joining & Tenant Journey Tracker
The entire tenant lifecycle is now visualized via clear, horizontal progress bars right on your home dashboard.
Highlights
- Full-Journey Visual Chain: Watch prospects move in real time across every status step: New → Qualified → Token → Paid → Lost → Converted.
- Cohesive Conversion Metrics: Track how many raw leads successfully convert into paying, active occupants (e.g., 4 out of 73 new leads converted).
- Occupancy Flows: Visually check ongoing tenant transitions across active residency, move-out notice states, and active evictions.
How to try
- Step 1: Log in to the Web App
Open the web version of the app and enter your login credentials. Once logged in, you will be taken to the Dashboard.


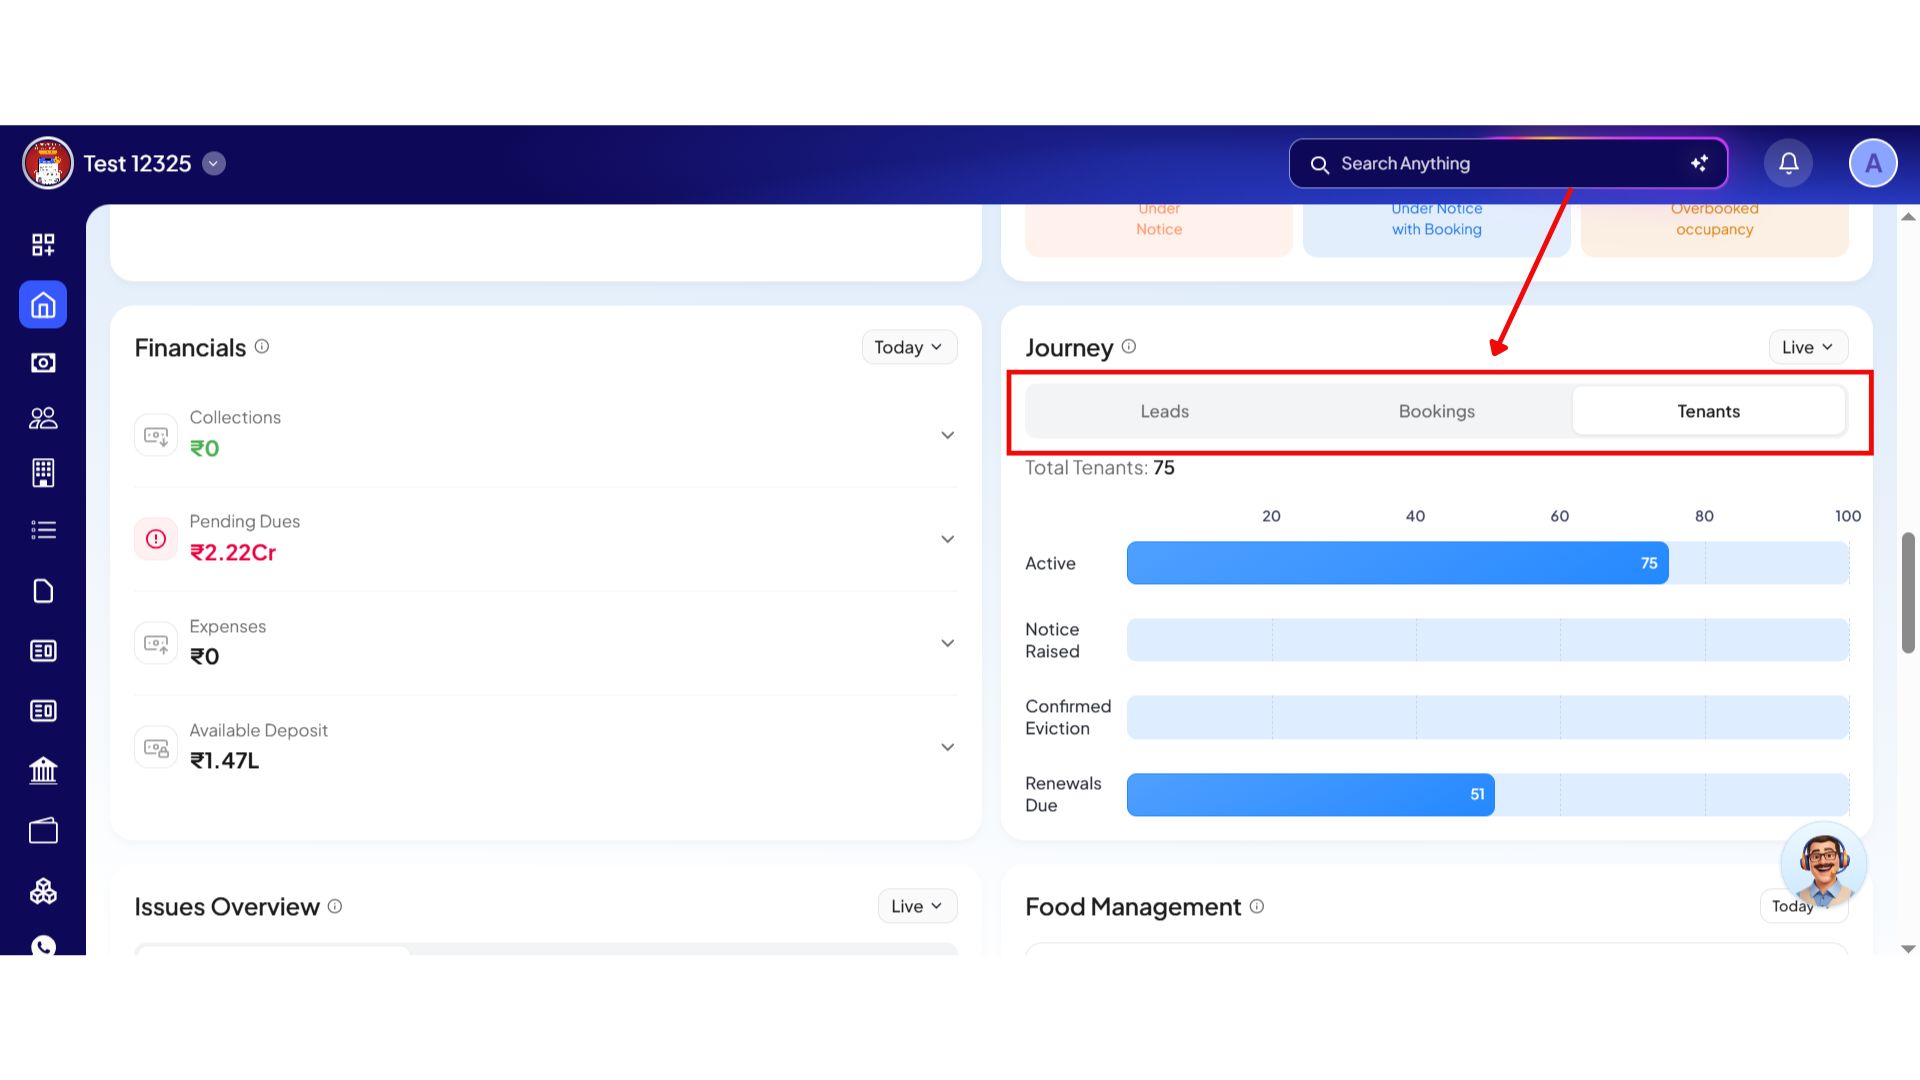
- Step 2: Open the Journey Section
On the Dashboard, scroll down until you see the Journey section. This area shows an overview of tenant activity and movement.
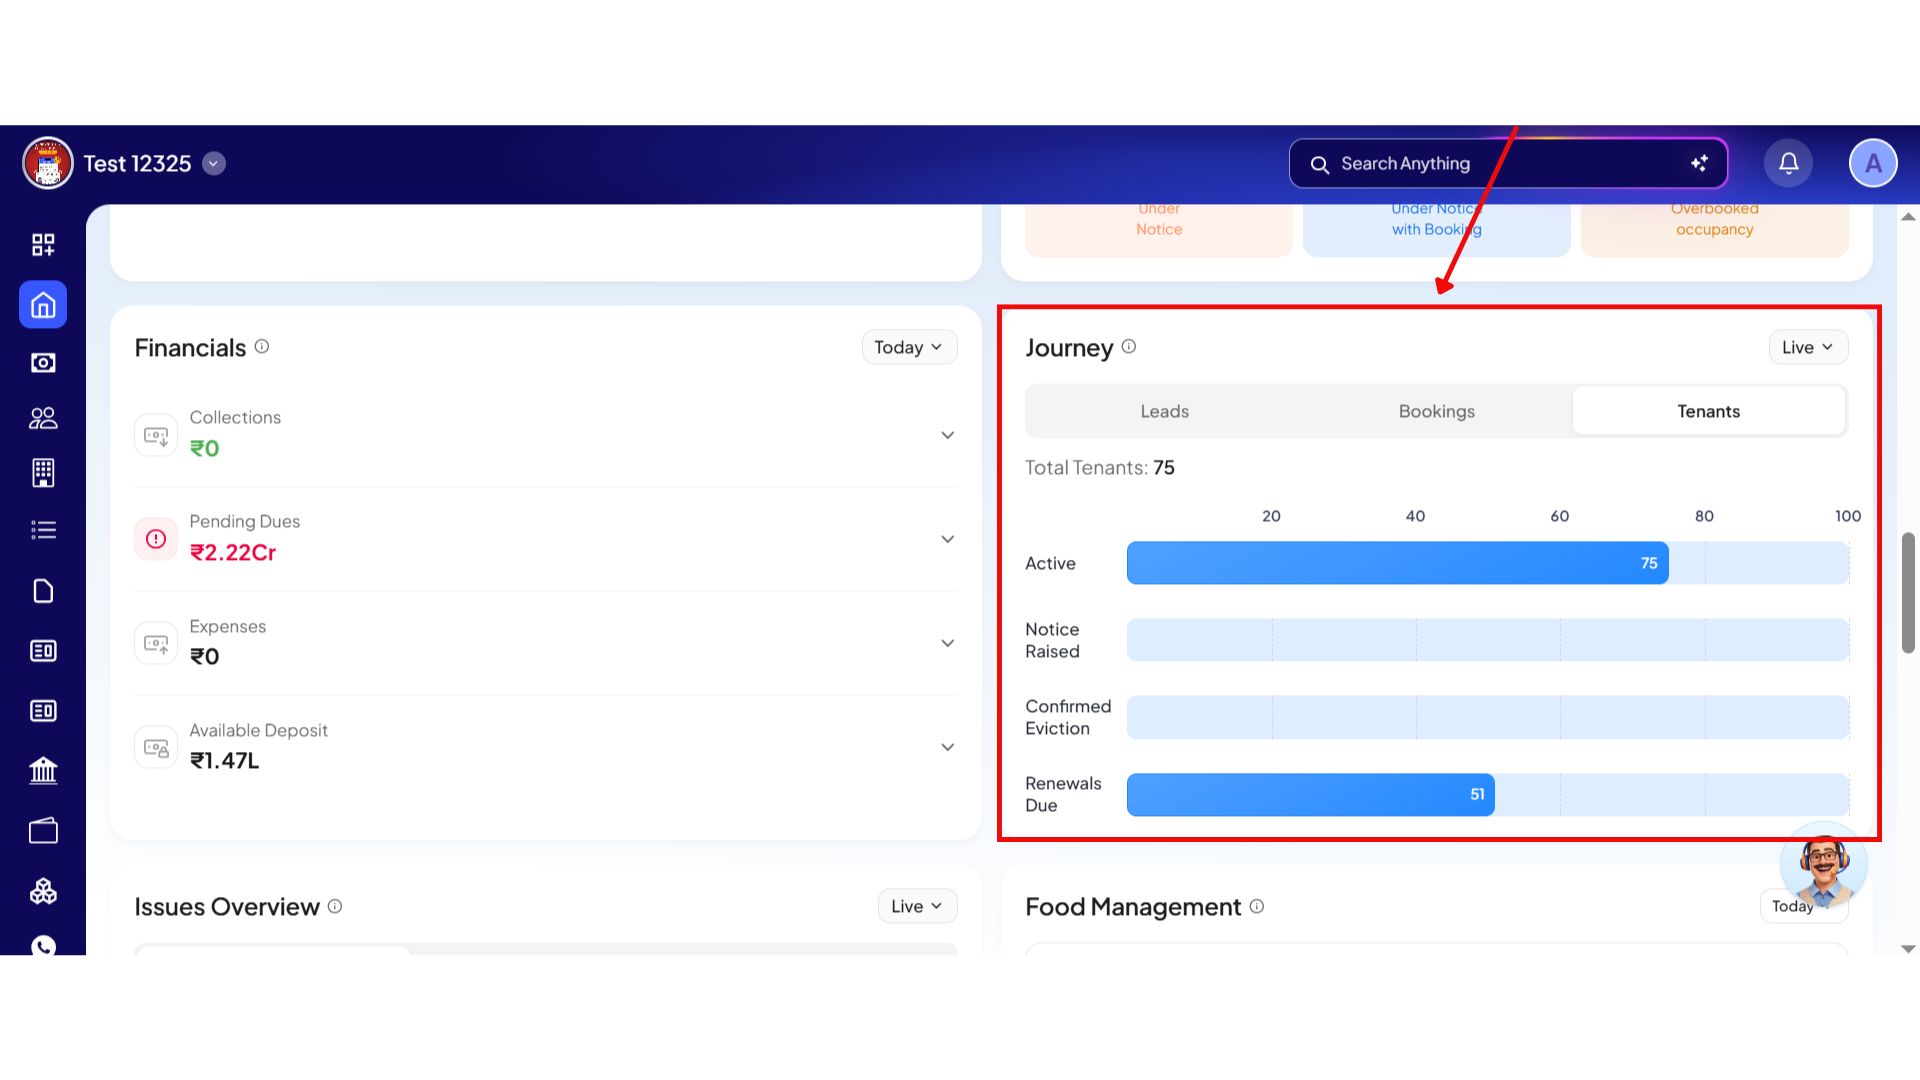
- Step 3: View Journey Insights
Inside this section, you will be able to see data related to:
- Total Tenants
- Leads
- Bookings
These sections help you understand the current status and flow of tenants across different stages.


- Step 4: Open Detailed Pages
You can click on any of the sections to directly open the detailed page for that component.

For example, clicking on tenants will take you to the tenants overview section, while clicking on Bookings will open the booking details page.
💡 Why it matters: This provides a clear view of your sales and onboarding pipelines on a single screen, helping you catch lead drops or notice bottlenecks instantly.
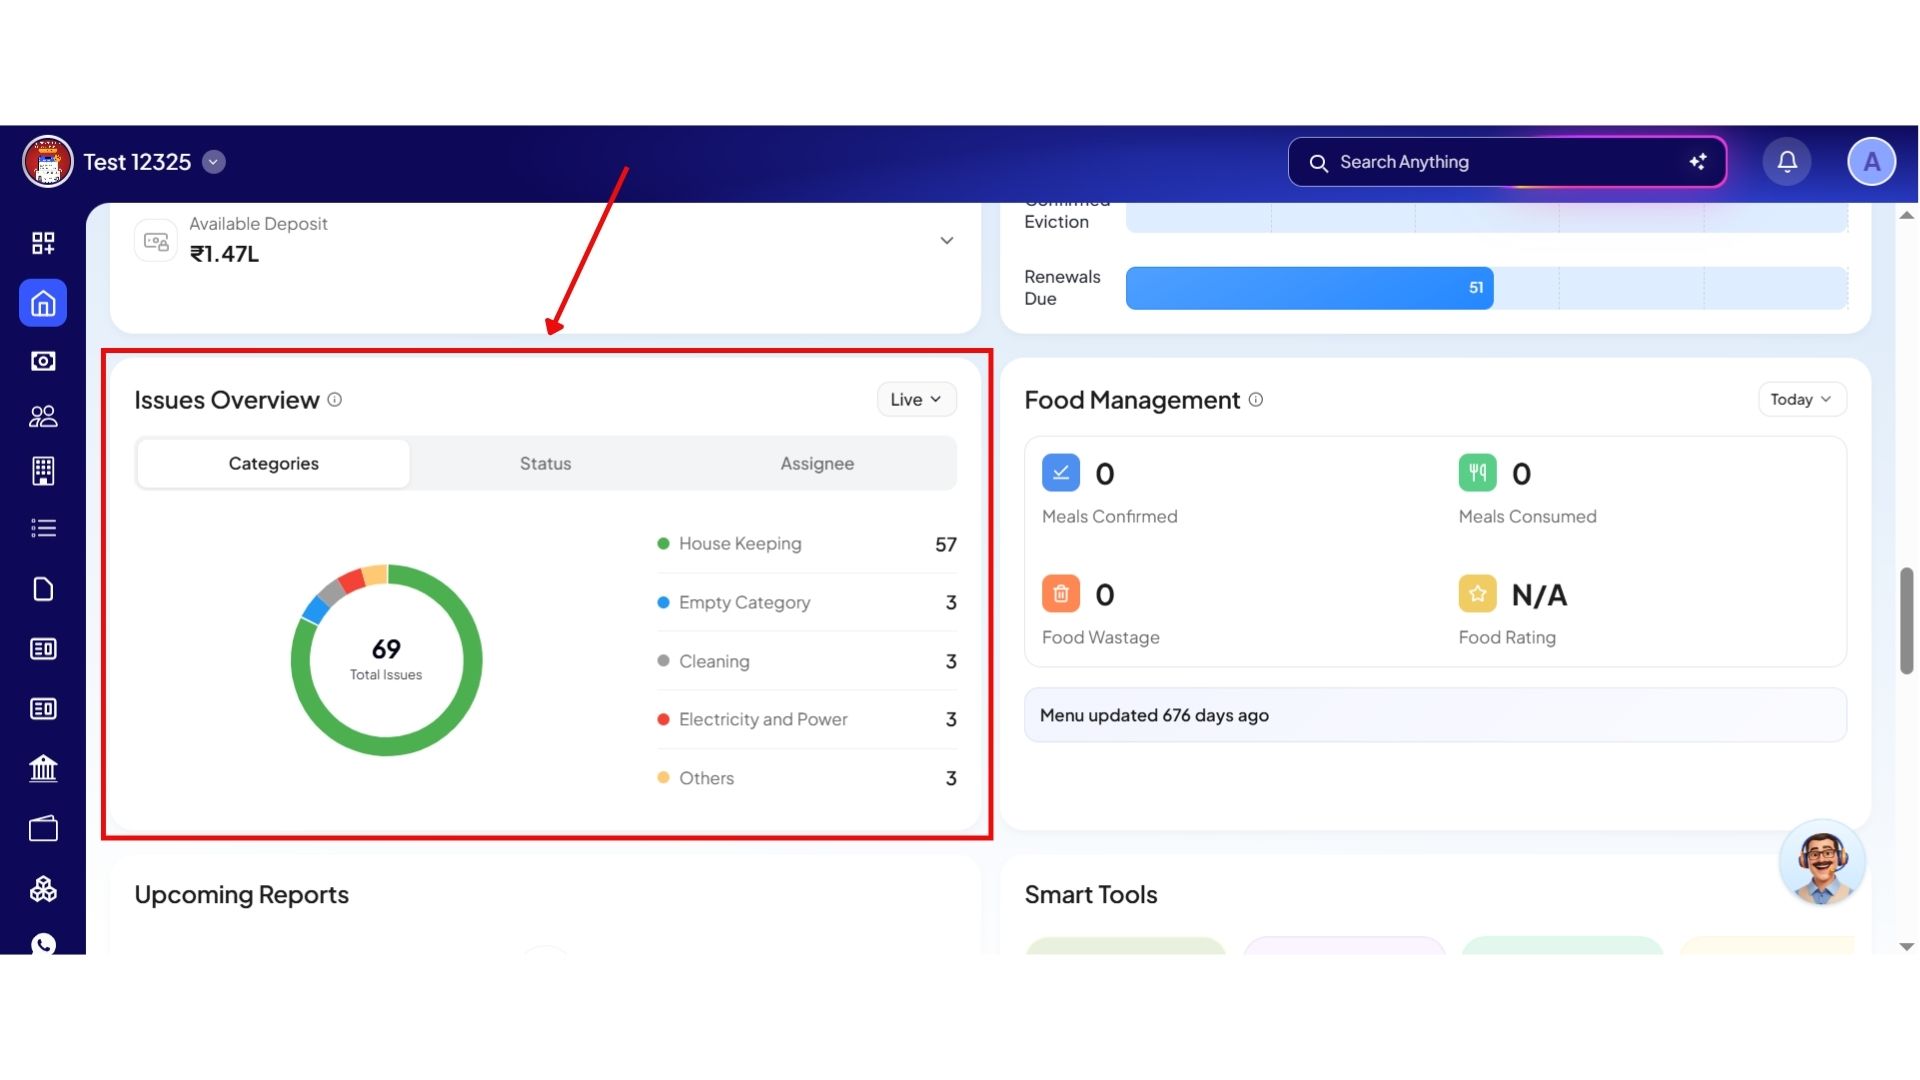
Multi-Tab Issues Overview
Monitoring property maintenance tickets no longer requires calling managers or searching through individual logs.
Highlights
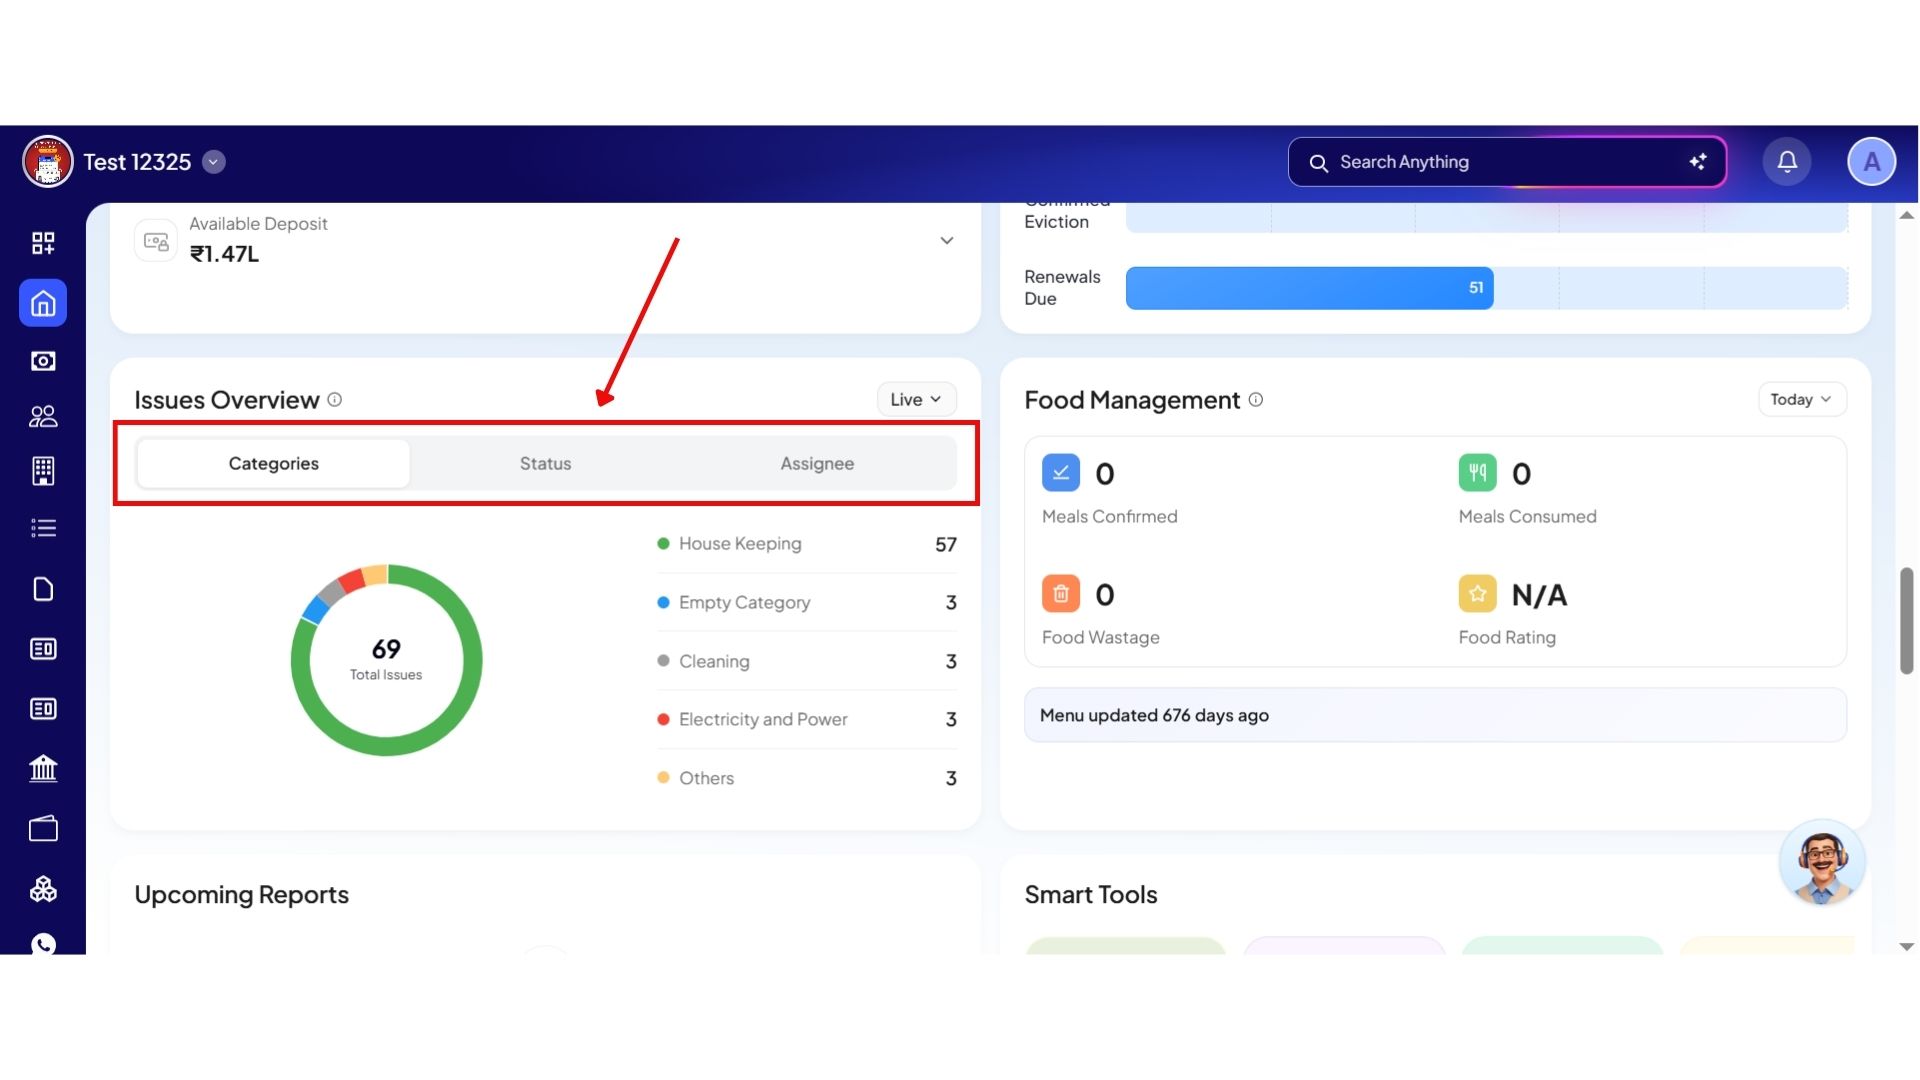
- Three-Way Tab Engine: Quickly switch views at the top of the card between Category, Status, and Assigned.
- Staff Accountability Tracking: See exactly which team members have active complaints assigned to them, and catch unassigned issues instantly.
- Top-4 Status Slices: Review immediate ticket breakdowns across open, in-progress, delayed, or closed phases.
How to try
- Step 1: Log in to the Web App
Open the web version of the app and enter your login credentials. Once logged in, you will be taken to the Dashboard.


- Step 2: Open the Issue Overview Section
On the Dashboard, scroll down until you see the Issue Overview box.
- Step 3: View Issue Categories
Inside this section, you will see different tabs such as:
- Categories
- Status
- Assignee
These tabs help you organize and view issues based on different filters.
- Step 4: Check Issue Details
From this section, you can get a quick overview of all the categories, status and assignee across your properties. This helps you monitor issue distribution and track ongoing tasks more efficiently.


- Step 5: Open Detailed Issue Pages
You can click on any category, status, or assignee section to directly open the detailed page related to that component.

💡 Why it matters: This keeps your maintenance and on-site staff completely accountable. You can see what complaints are stuck and who is handling them without manual check-ins.
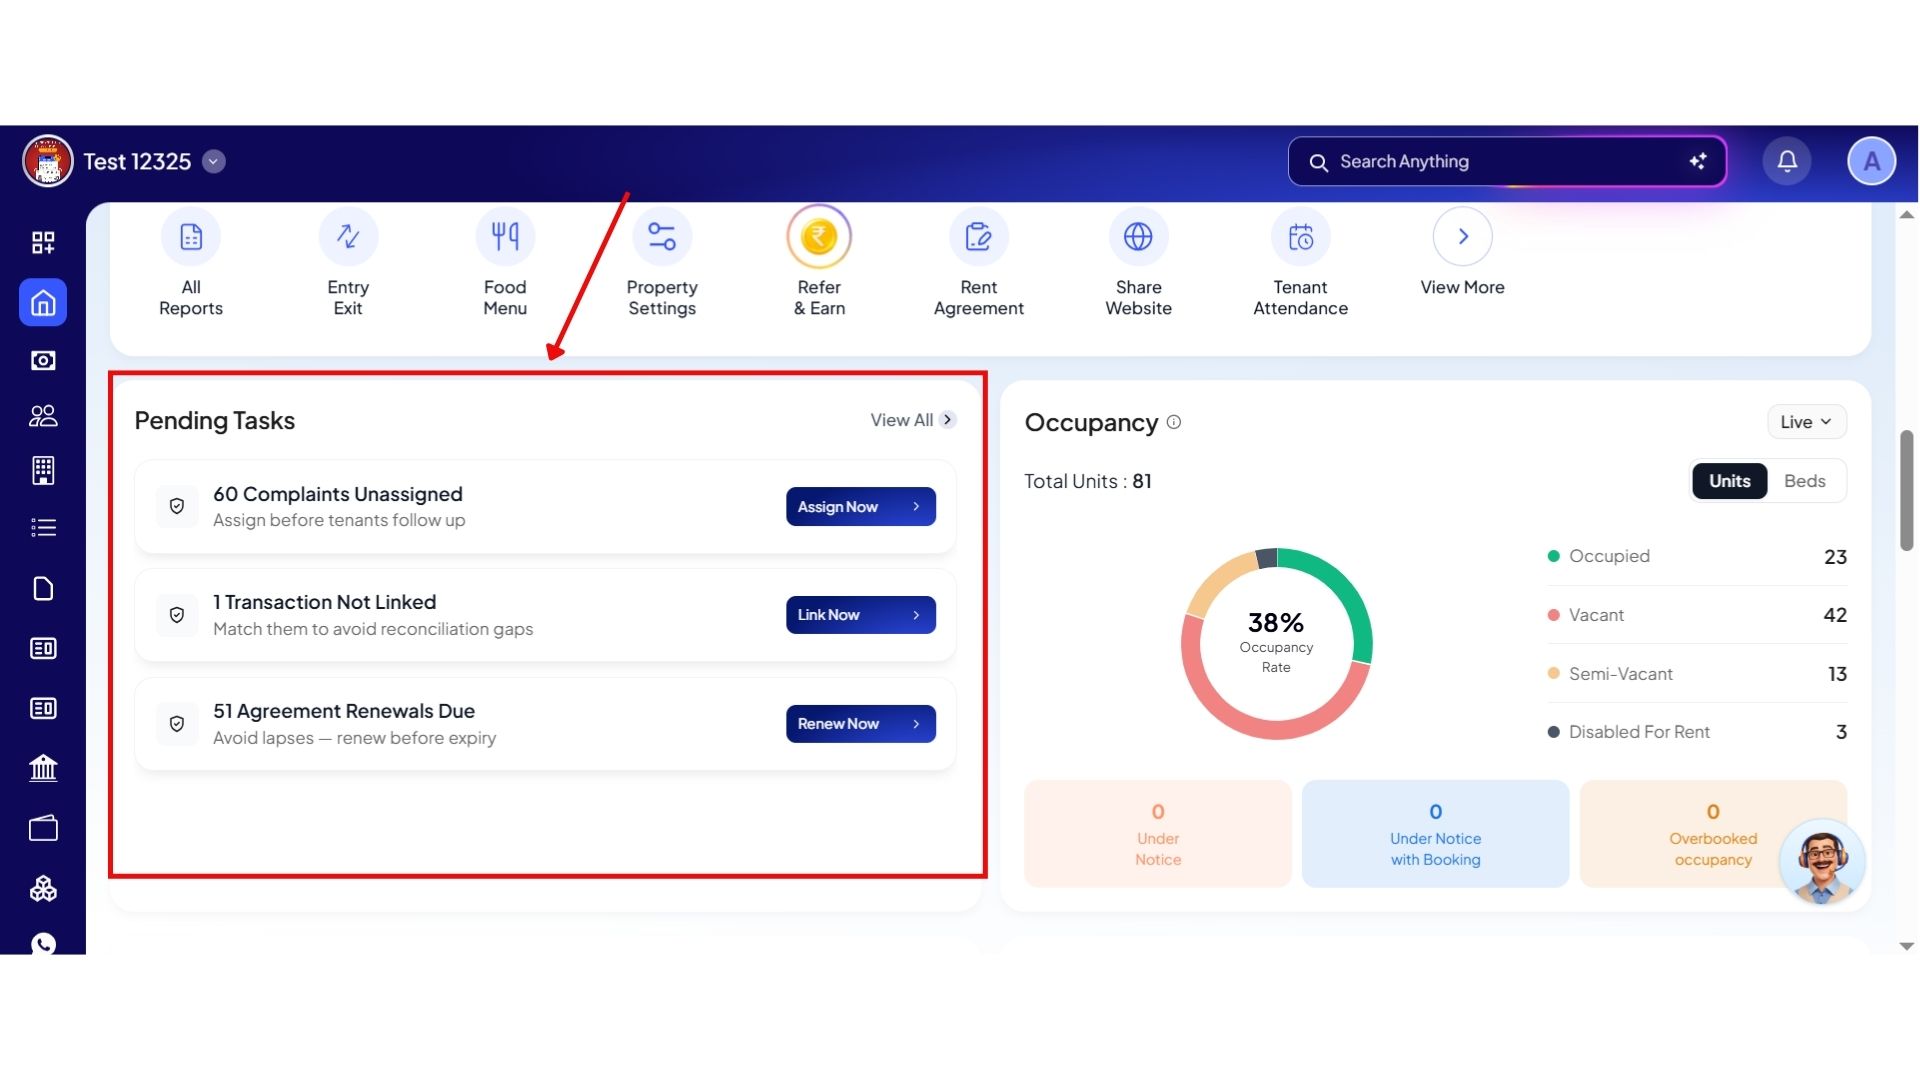
Role-Aware Screen Customization & Pending Tasks
The home dashboard now adapts completely based on who is logged in. Staff members see only what they have permission to access, removing unnecessary operational clutter.
Highlights
- Access-Scoped Card Hidden Rules: Financial metrics or room setup sections vanish completely for team members who lack matching backend access permissions.
- Permission-Bound Actions: Functional shortcuts like the "Add Tenant" button are hidden if a staff role does not have user-creation clearance.
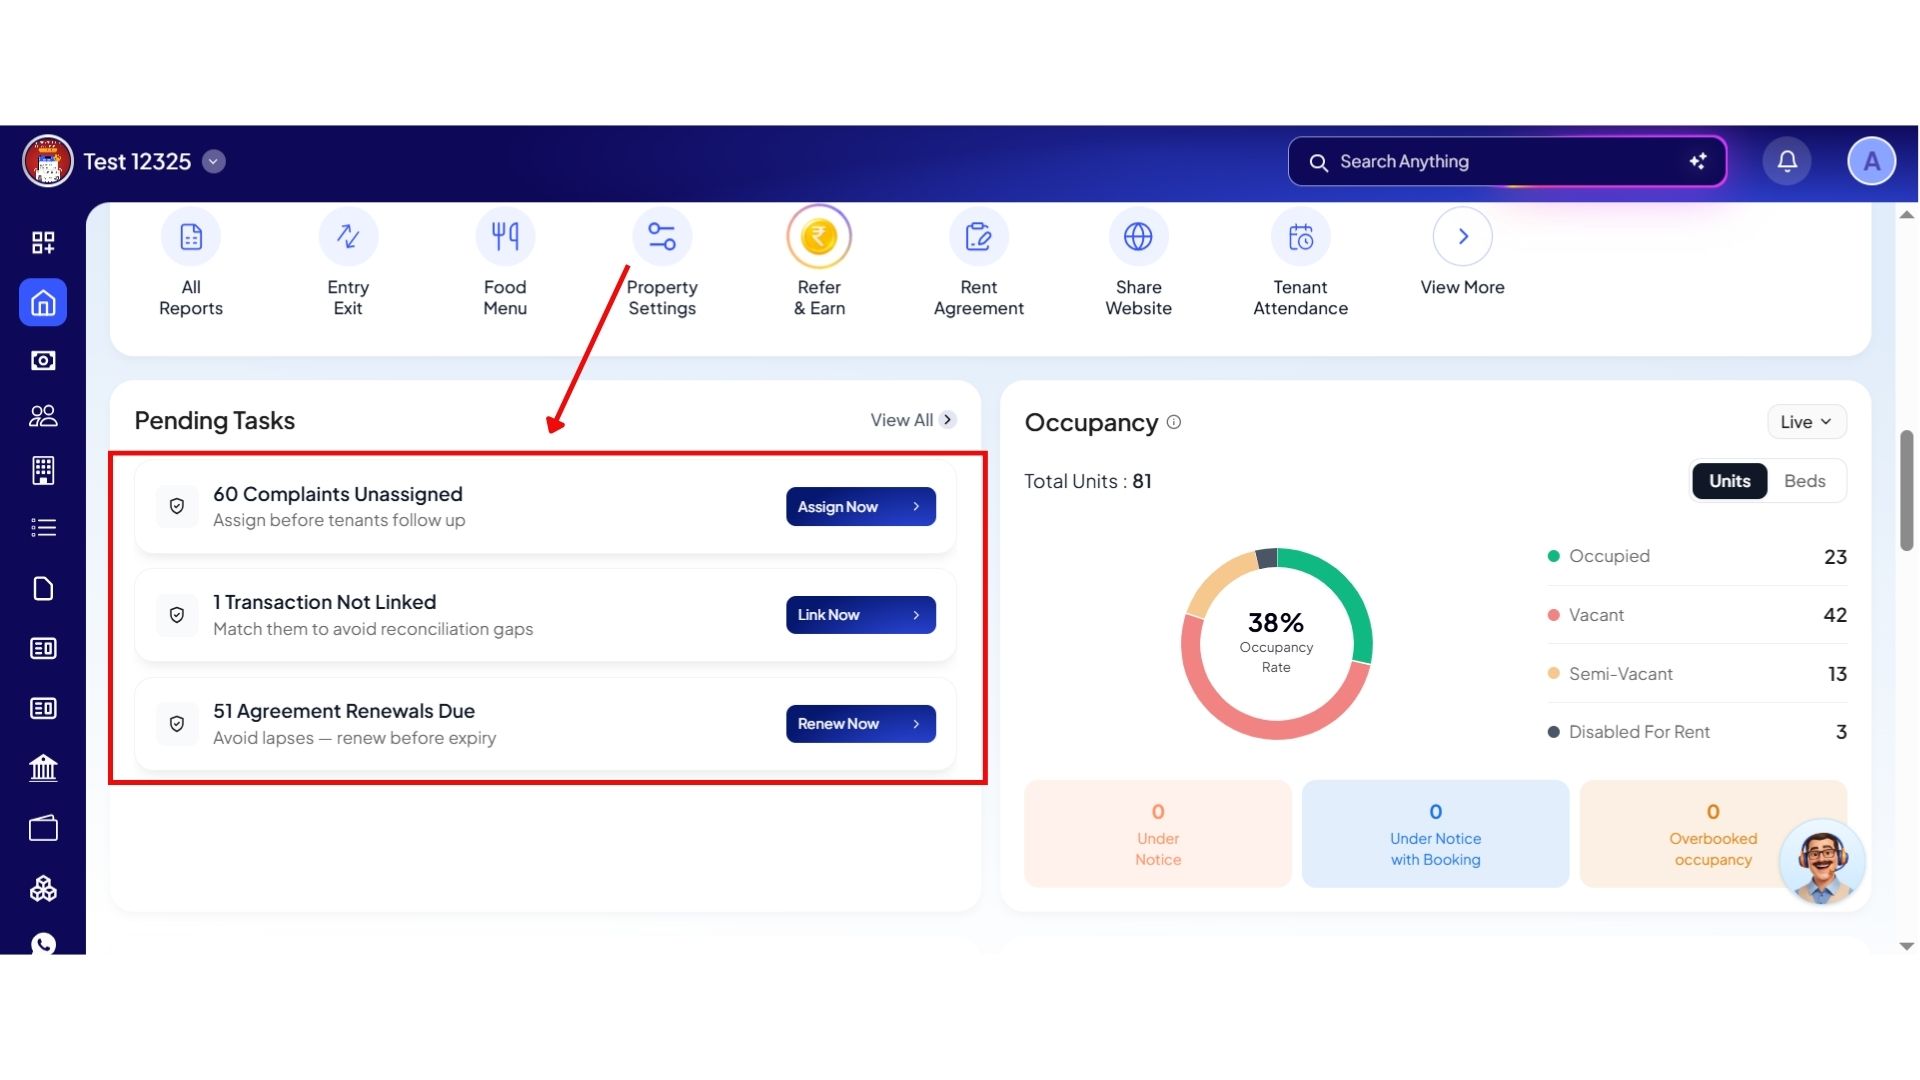
- Personalized Pending Tasks: The task widget displays only the specific items assigned to that logged-in user.
How to try
- Step 1: Log in to the Web App
Open the web version of the app and enter your login credentials. Once logged in, you will be taken to the Dashboard.


- Step 2: Open the Pending Tasks Section
On the Dashboard, scroll down until you see the Pending Tasks box.
- Step 3: View All Pending Tasks
Inside this section, you will be able to see pending tasks. Click on View All to open the complete pending tasks list. From here, you can see tasks grouped under different categories, like:
- Property
- Money
- People
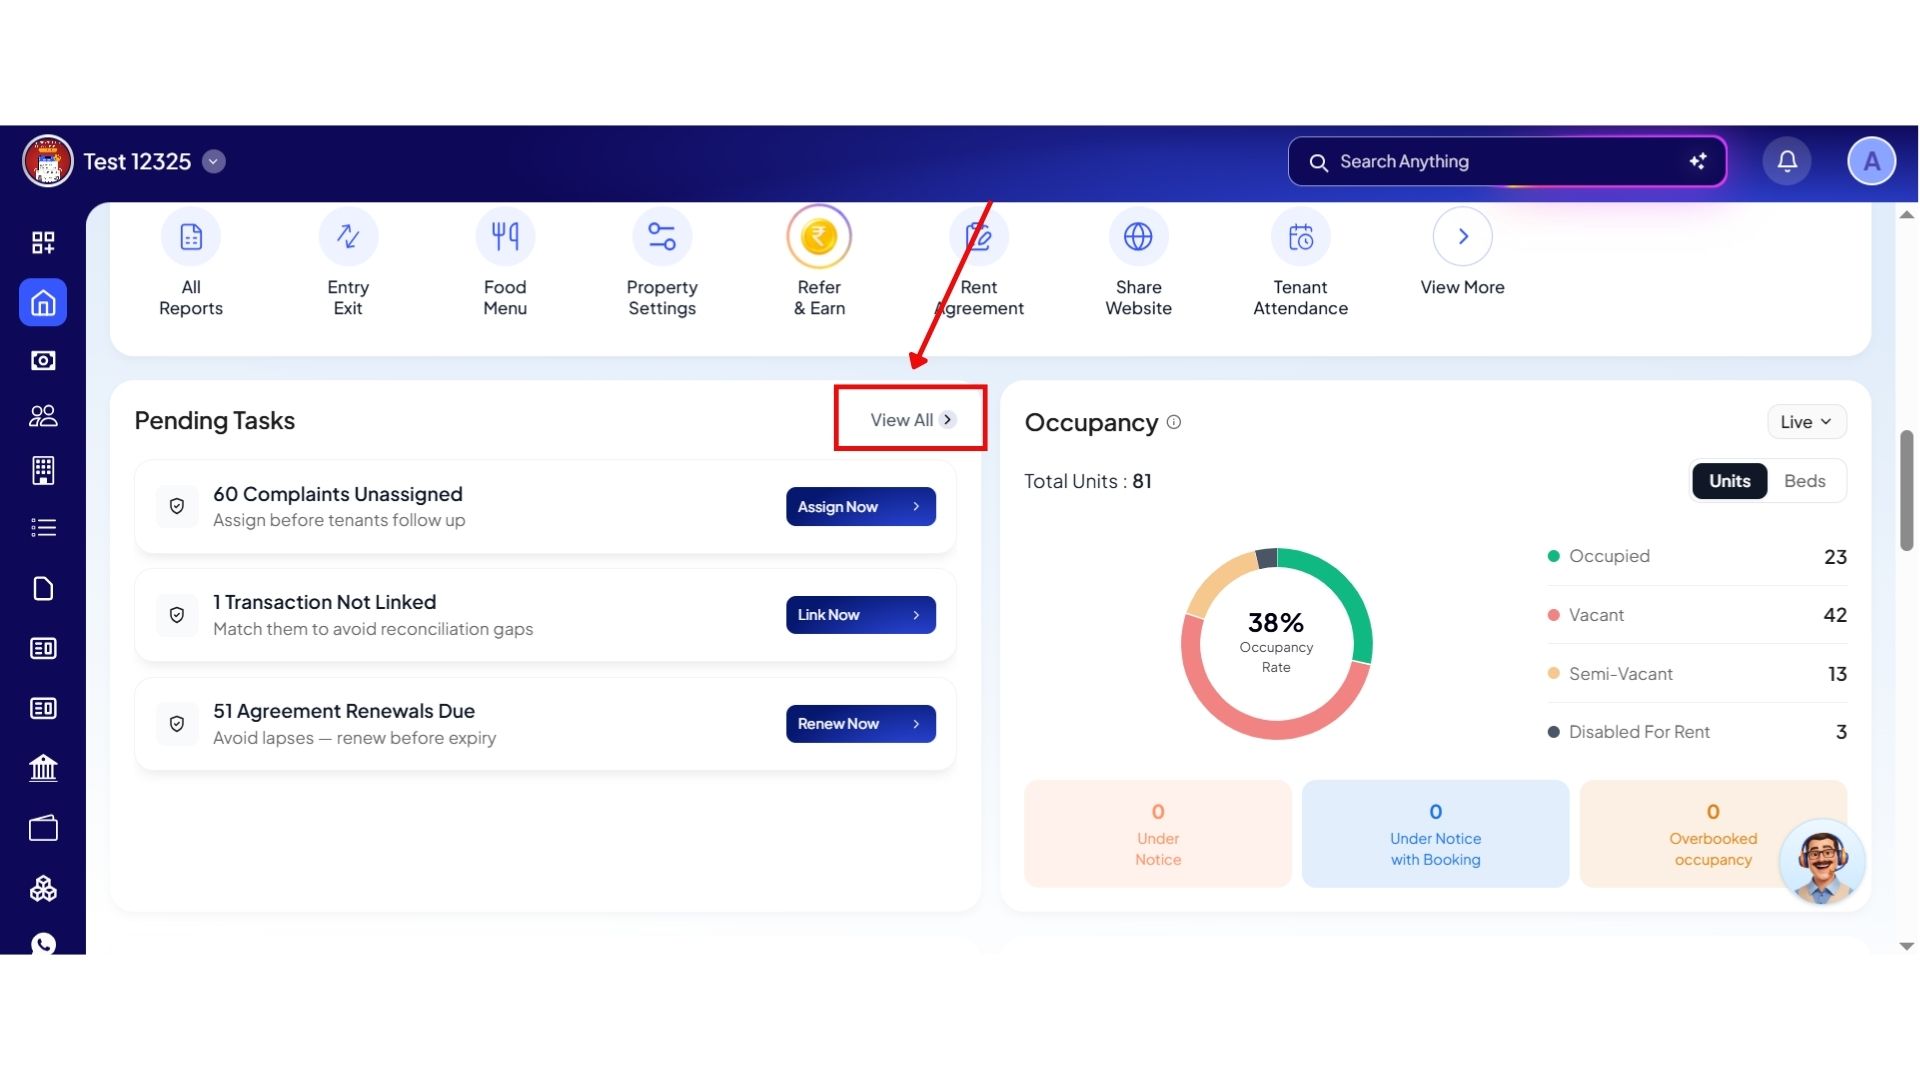
- Step 4: Manage Specific Tasks
In the Pending Tasks section, you may see tasks such as:
- Unassigned Complaints
- Transactions Not Linked
- Agreement Renewal Dues

You can click on any task to open its detailed page and complete the required action directly from there.
- Step 5: Track and Complete Tasks Easily
Using this section, you can monitor unresolved activities, manage pending actions faster, and keep your operations organized from the Dashboard itself.
💡 Why it matters: This eliminates system data leaks, simplifies training for new staff, and ensures your team stays focused entirely on their specific daily roles.
Inline Glossary & Info Explainer ("i" Buttons)
To completely remove confusion over how specific metrics are calculated, we have integrated plain-language descriptions directly into the card headers.
Highlights
- Inline Graph Legends: Tap the info indicator next to complex data items for a clear explanation of the metric.
- Metric Clarification: Clear callouts explain data rules, such as outlining that Total Views applies strictly to active tenants and current bookings while completely excluding past data.
-d744d7449dd4ee02fee588ac2ca05476.jpg)

💡 Why it matters: This removes confusion when reviewing complex figures, ensuring that owners, partners, and cluster managers are always aligned on the numbers.
Food Attendance Control
Properties running our integrated food management system now feature an upgraded, high-impact scheduling card on the primary home dashboard.
Highlights
- 3-Day Window Evaluation: Review meal confirmation logs for yesterday, today, or look ahead up to 1 day.
- Automated Wastage Calculations: The dashboard automatically calculates food waste by subtracting actual QR attendance scans from pre-confirmed meals.
How to try
- Step 1: Log in to the Web App
Open the web version of the app and enter your login credentials. Once logged in, you will be taken to the Dashboard.
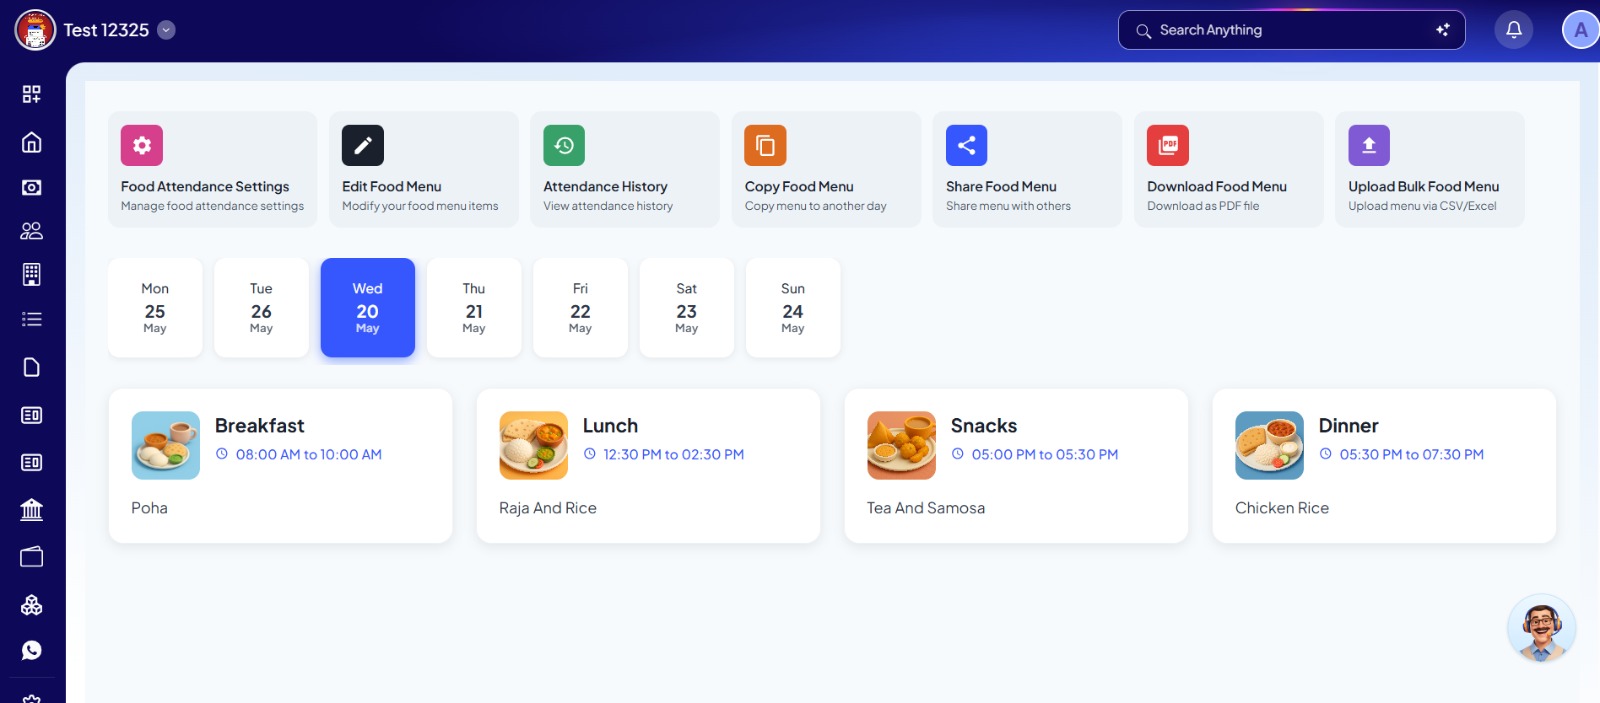
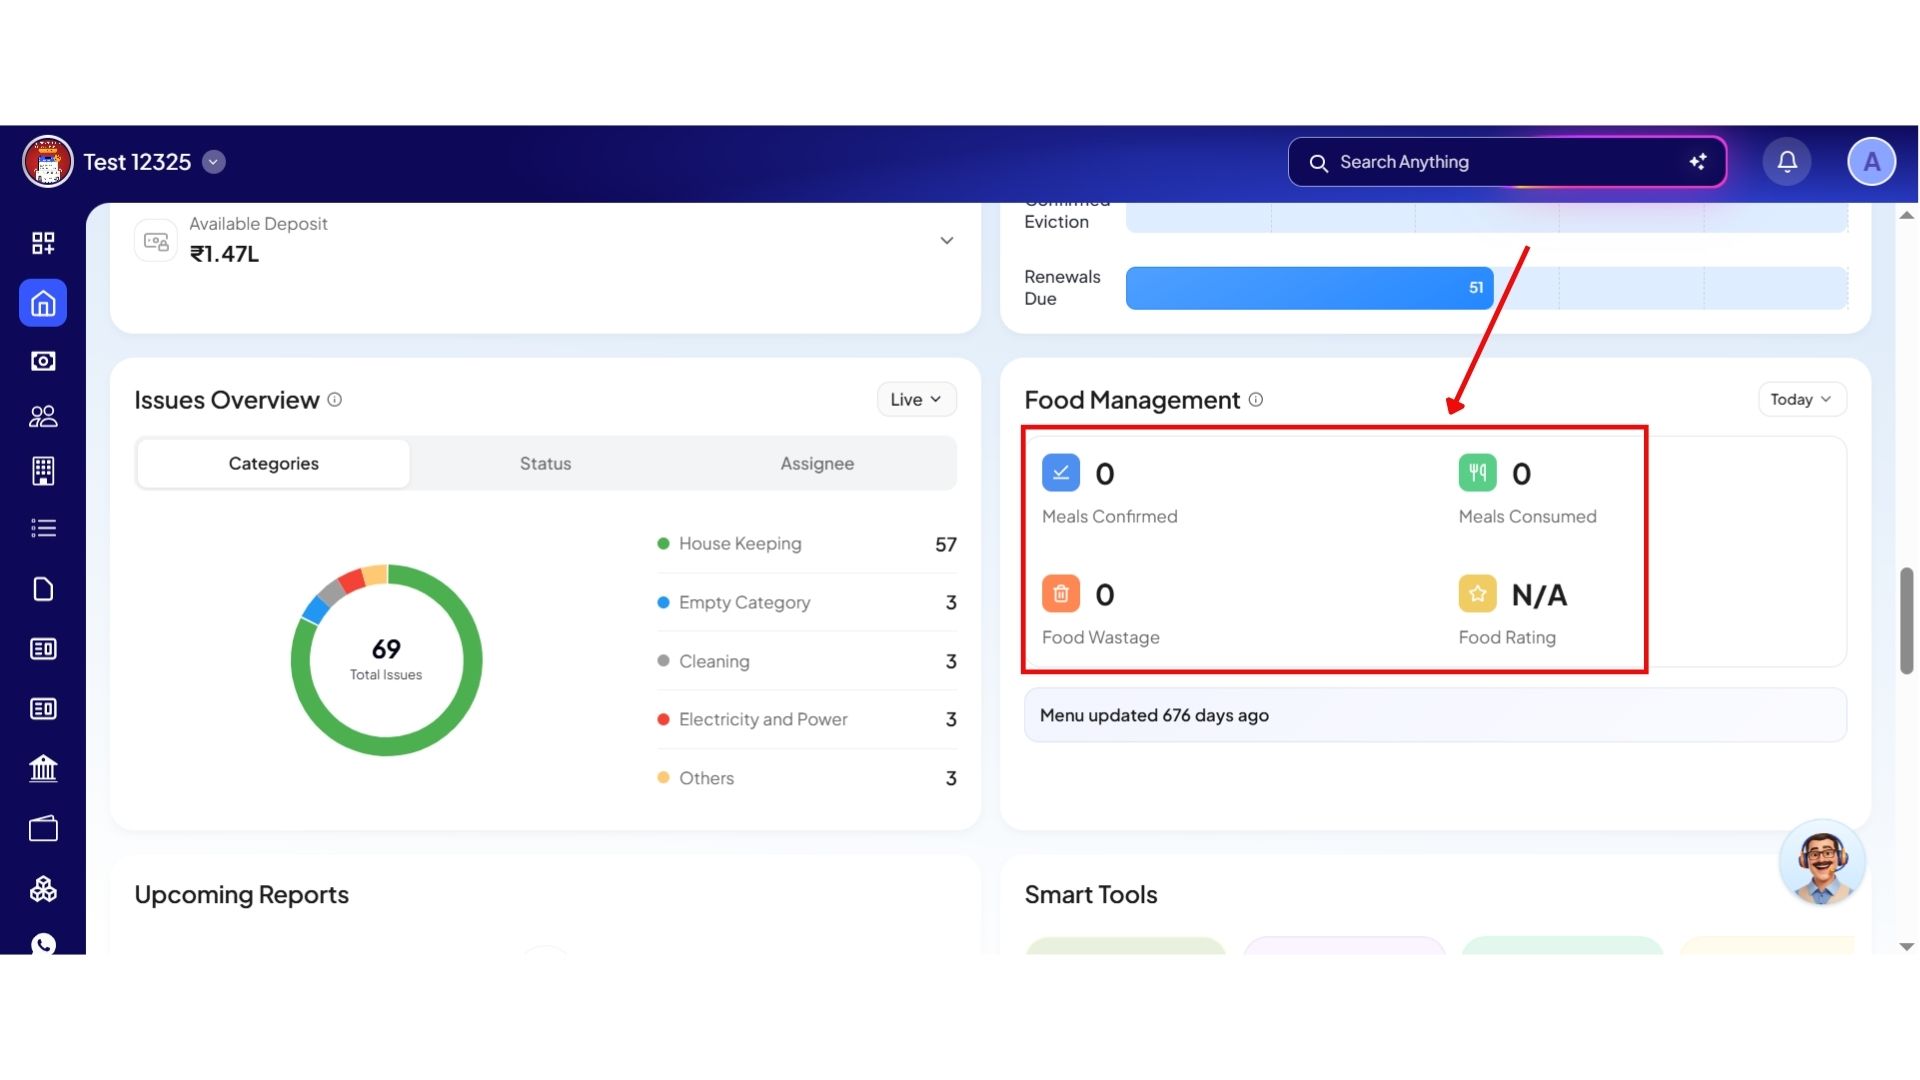
- Step 2: Open the Food Management Section
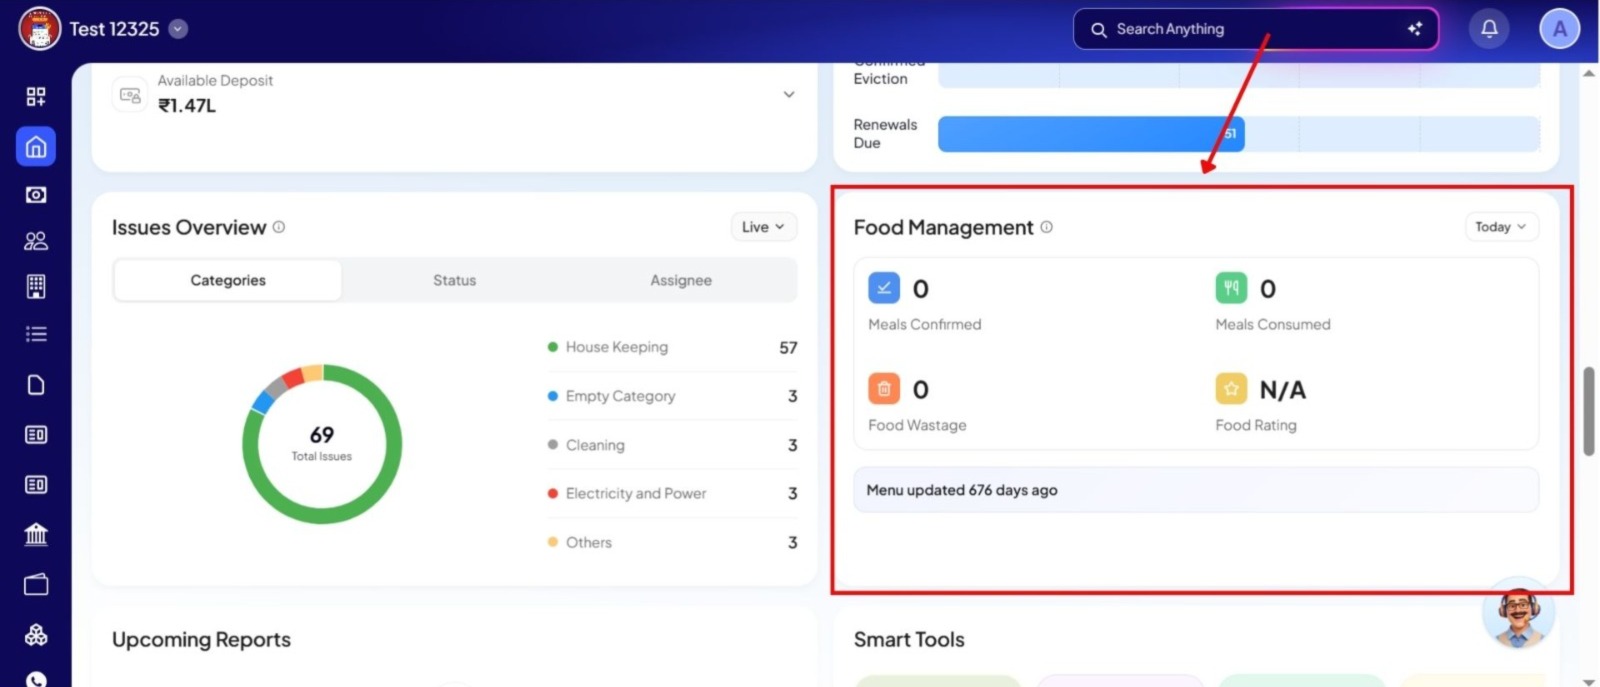
On the Dashboard, scroll down until you see the Food Management section.
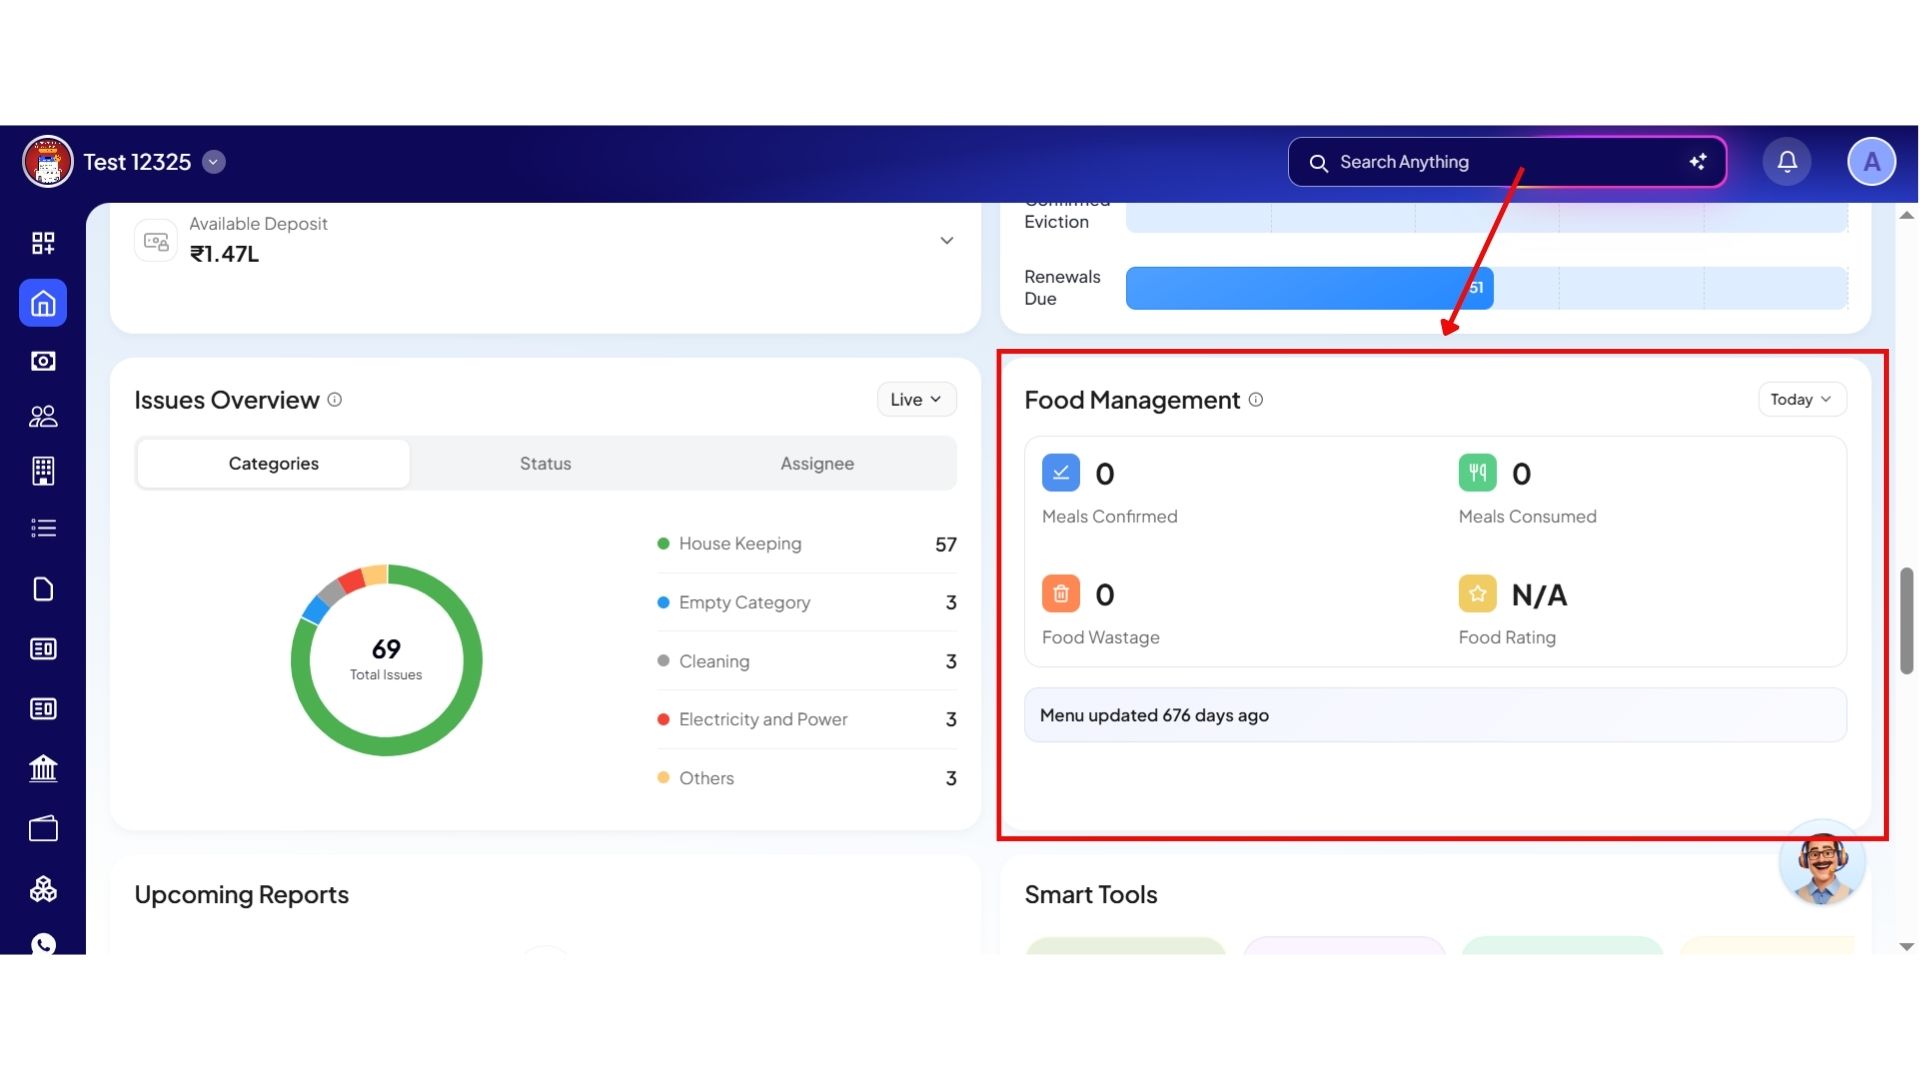
- Step 3: View Meal Attendance and Food Insights
Inside this section, you will be able to see:
- Meals Confirmed – tenants who confirmed they will have the meal for the day. Meal confirmations can be viewed for the last three days.
- Meals Consumed – tenants who have already had their meals for the day.
- Food Wastage – meals prepared but not consumed. This wastage is automatically calculated by the system based on attendance and consumption data.
- Food Ratings – the average tenant rating for the day’s meals out of 5.
You can also review meal confirmation logs for both today and previous days directly from this section.
💡 Why it matters: This gives you clear data to adjust kitchen catering quantities on the fly, saving money by cutting down food waste.
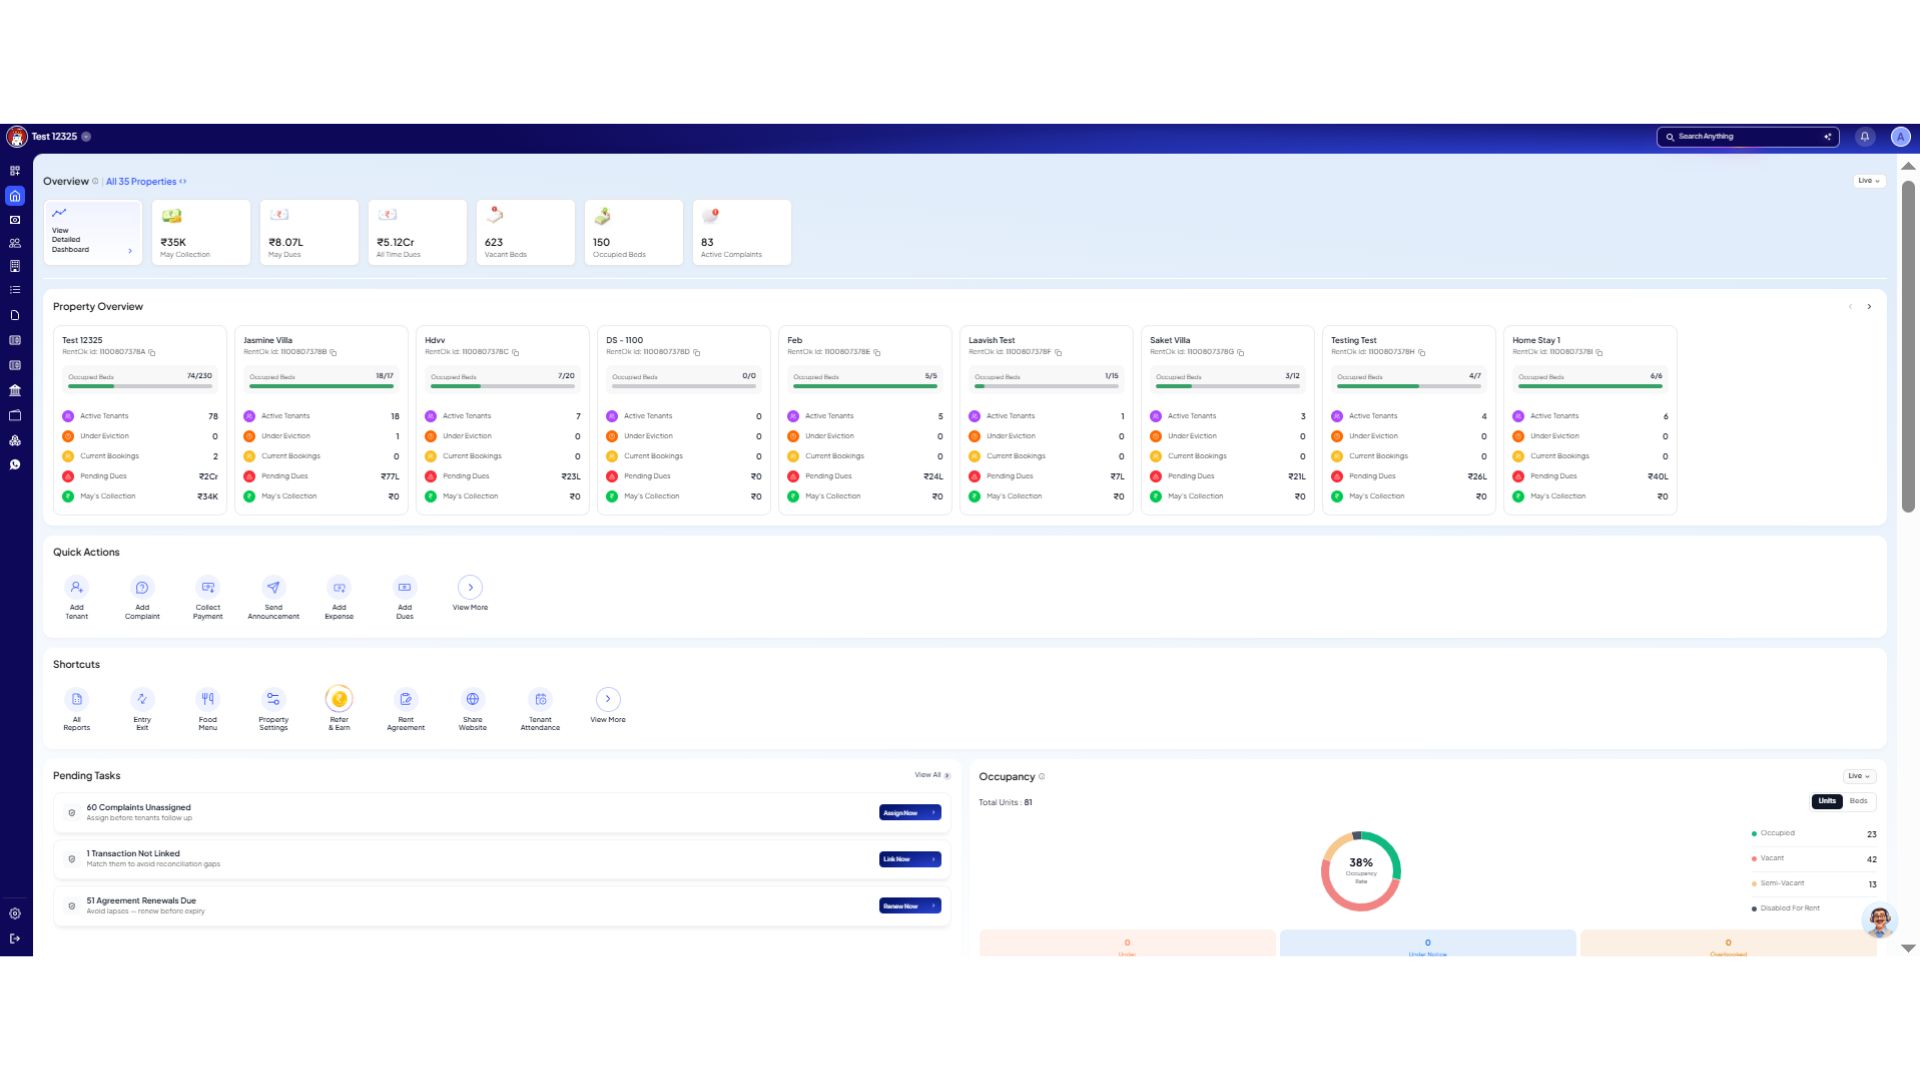
Advanced Portfolio Management
Bird's-Eye Dashboard - Cumulative Portfolio Analytics
We have launched a comprehensive overview dashboard designed explicitly for large portfolio management. This view aggregates data points from multiple properties simultaneously to show you the big picture.
Highlights
- Unified Metrics View: Monitor overall collections, open tickets, total vacancies, and high-priority tasks across your entire business footprint.
- Clutter-Free Analytics: Combines large mountains of data into a clean, comprehensive operational view.
How to try
- Step 1: Log in to the Web App
Open the web version of the app and enter your login credentials. Once logged in, you will be taken to the Dashboard.

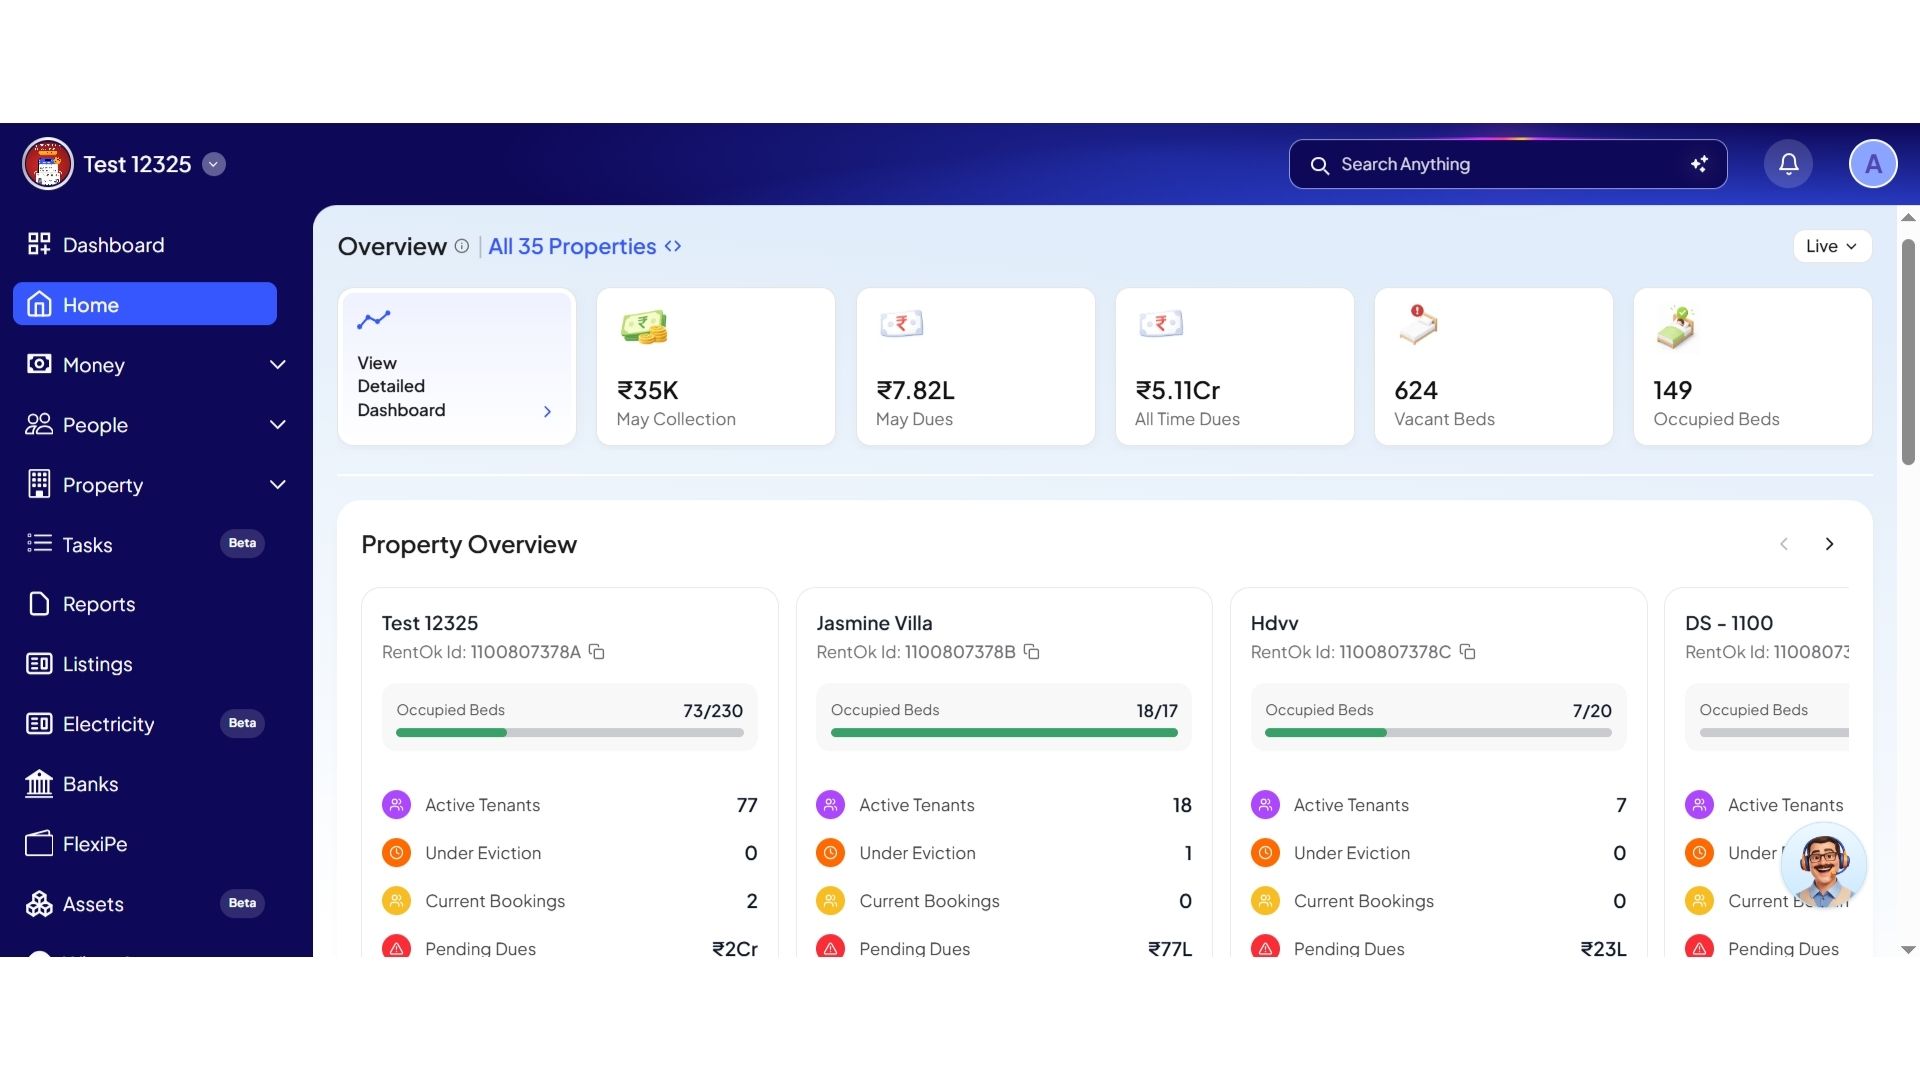
- Step 2: Open the Detailed Dashboard
On the Dashboard, click on the View Detailed Dashboard widget. This will open the Bird’s Eye Dashboard view.
- Step 3: View Property Insights
From here, you can view detailed insights for an individual property separately.

- Step 4: Switch to Combined Summary
If you want to see a combined overview of all your properties together, turn on the Combined Summary toggle. This will display consolidated insights across all properties in one view.
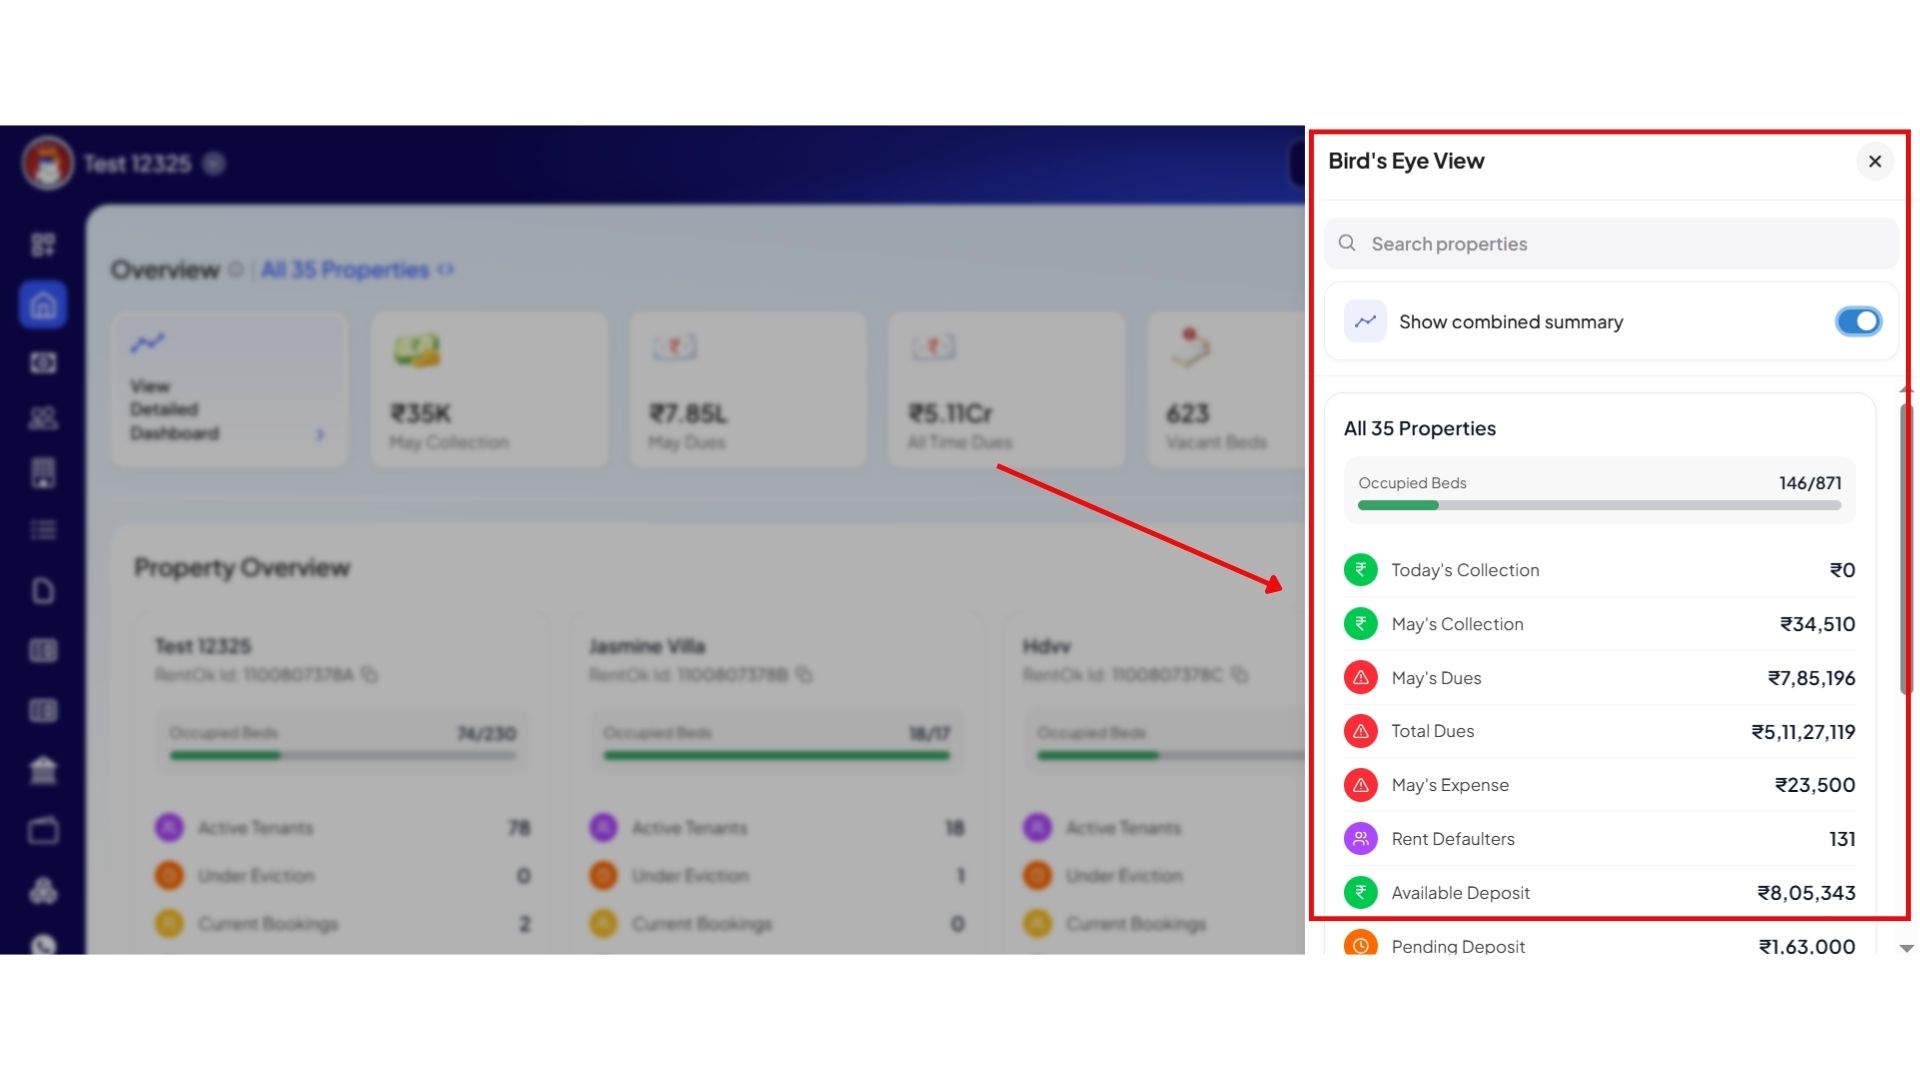
💡 Why it matters: This is a major update for multi-property owners. You no longer have to toggle between individual building screens to calculate your overall business health.
Area & Property-Wise Selection Views - Quick Cluster Filtering
Managing specific segments of your portfolio is now much simpler. You can quickly filter your dashboard views by region or group.
Highlights
- Multi-Layer Selector Sidebar: Quickly switch dashboard views using individual Properties, broader geographic Areas, or custom-defined Groups/Clusters.
- Access-Scoped Grouping: Cluster managers (e.g., North Region vs. South Region managers) will only see performance metrics for the properties assigned to their accounts.
How to try
- Step 1: Log in to the Web App
Open the web version of the app and enter your login credentials. Once logged in, you will be taken to the Dashboard.


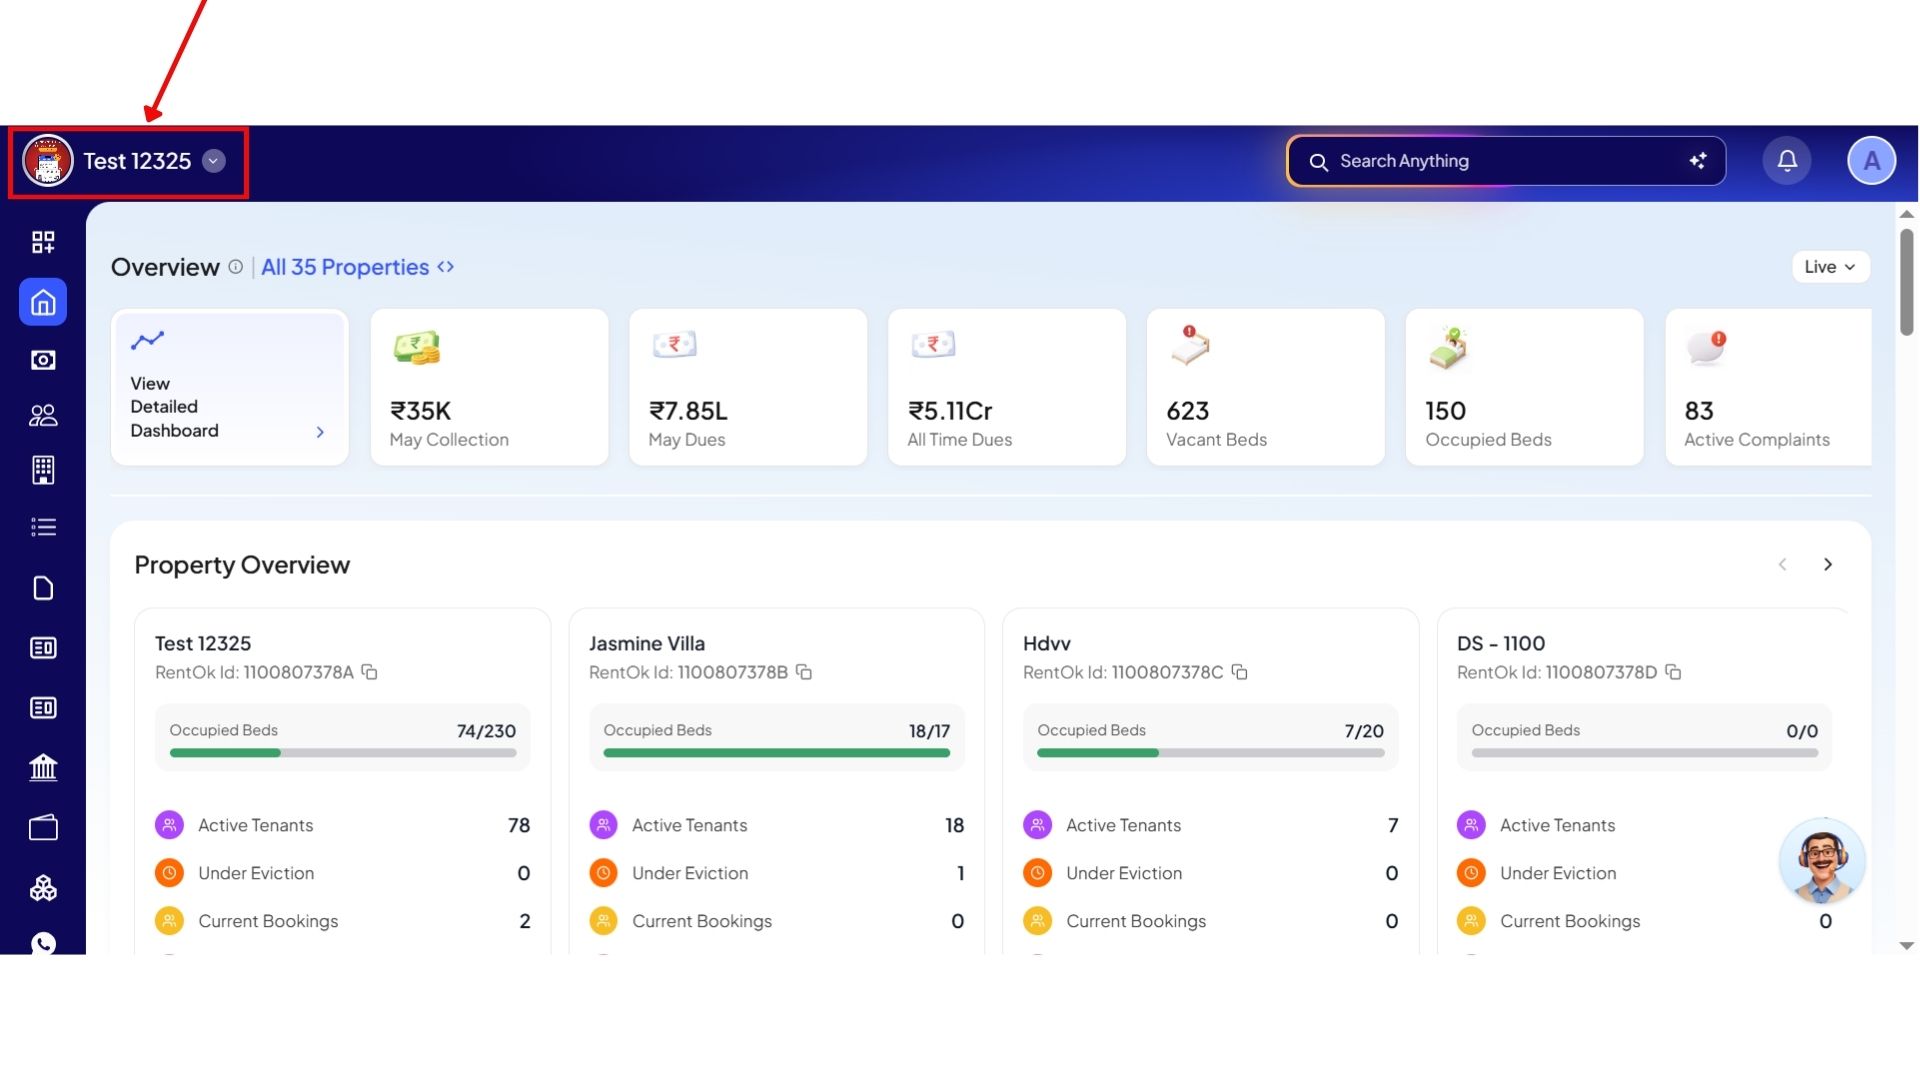
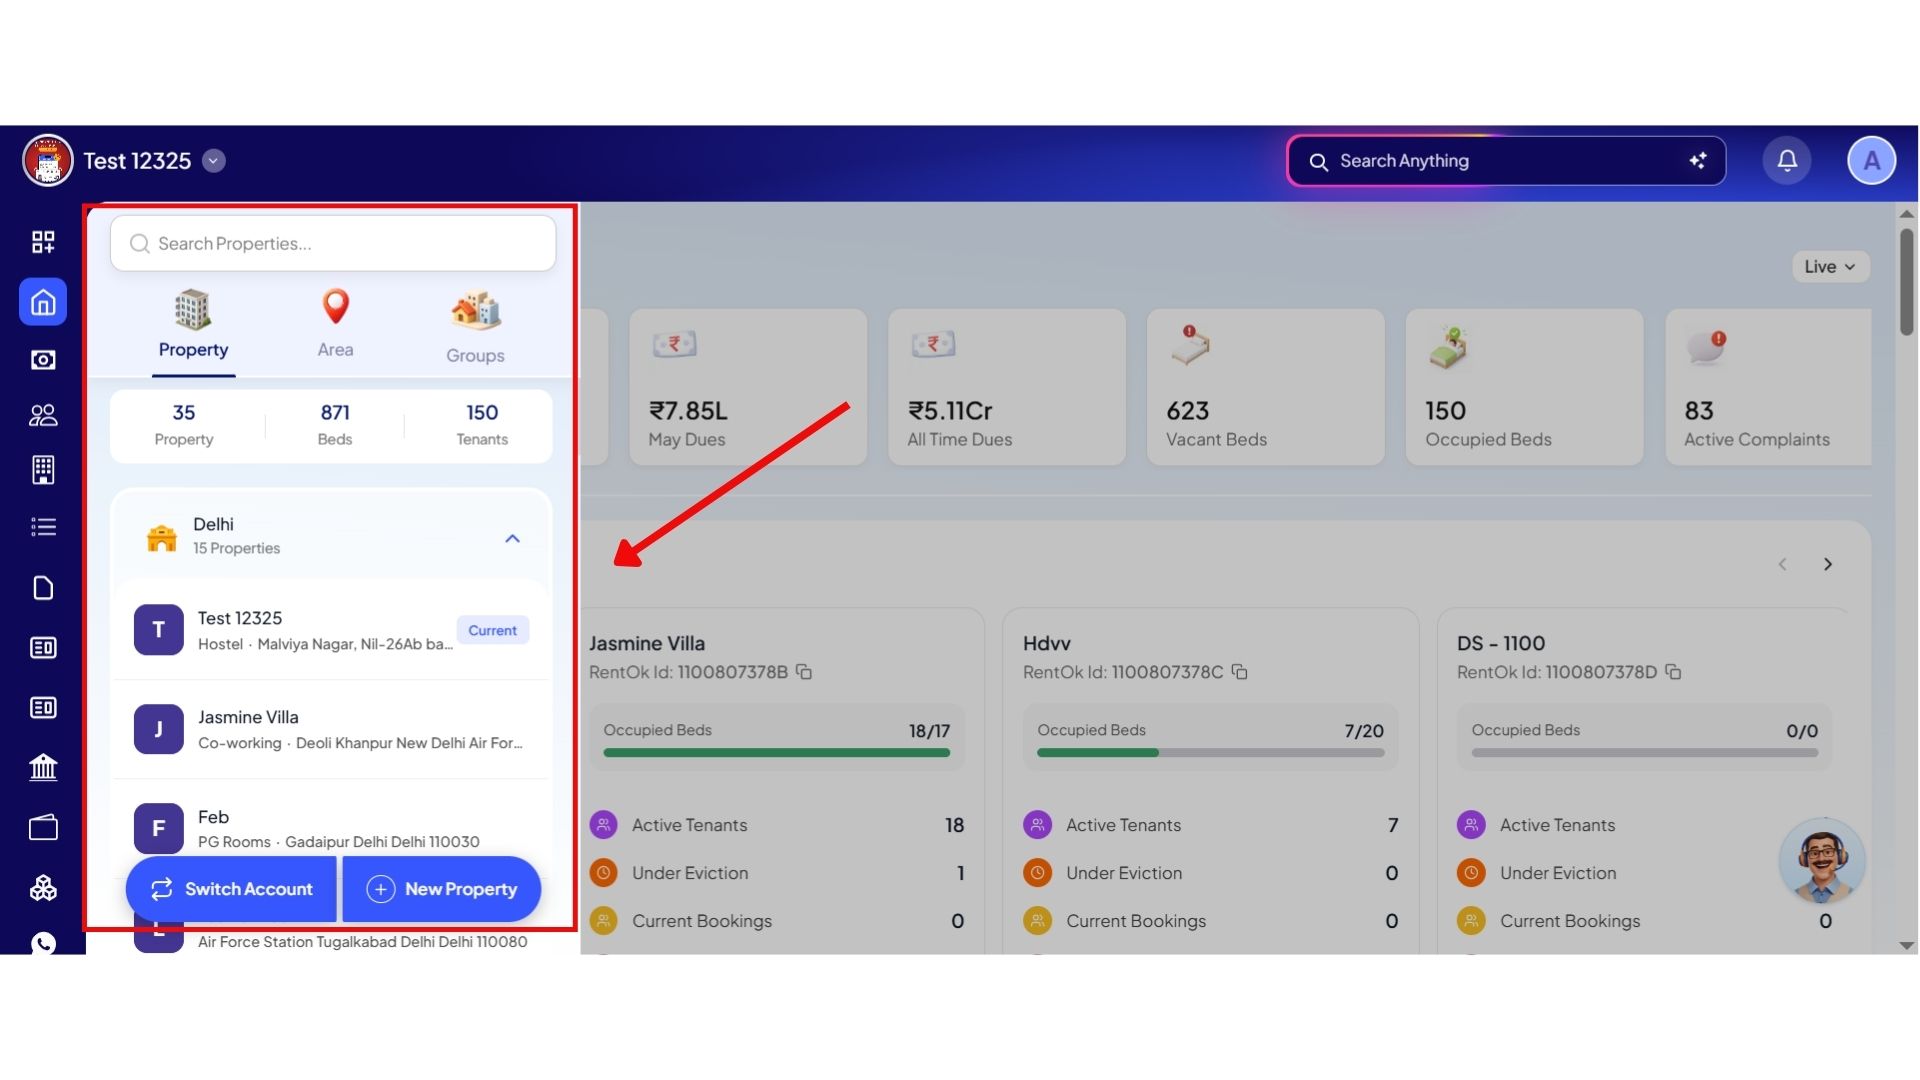
- Step 2: Open the Property Selection Screen
On the Dashboard, click on the property name shown in the top-left corner of the screen.
- Step 3: View Different Classification Options
A new screen will open where you can organize and view your properties under different categories such as:
- Property
- Area
- Groups
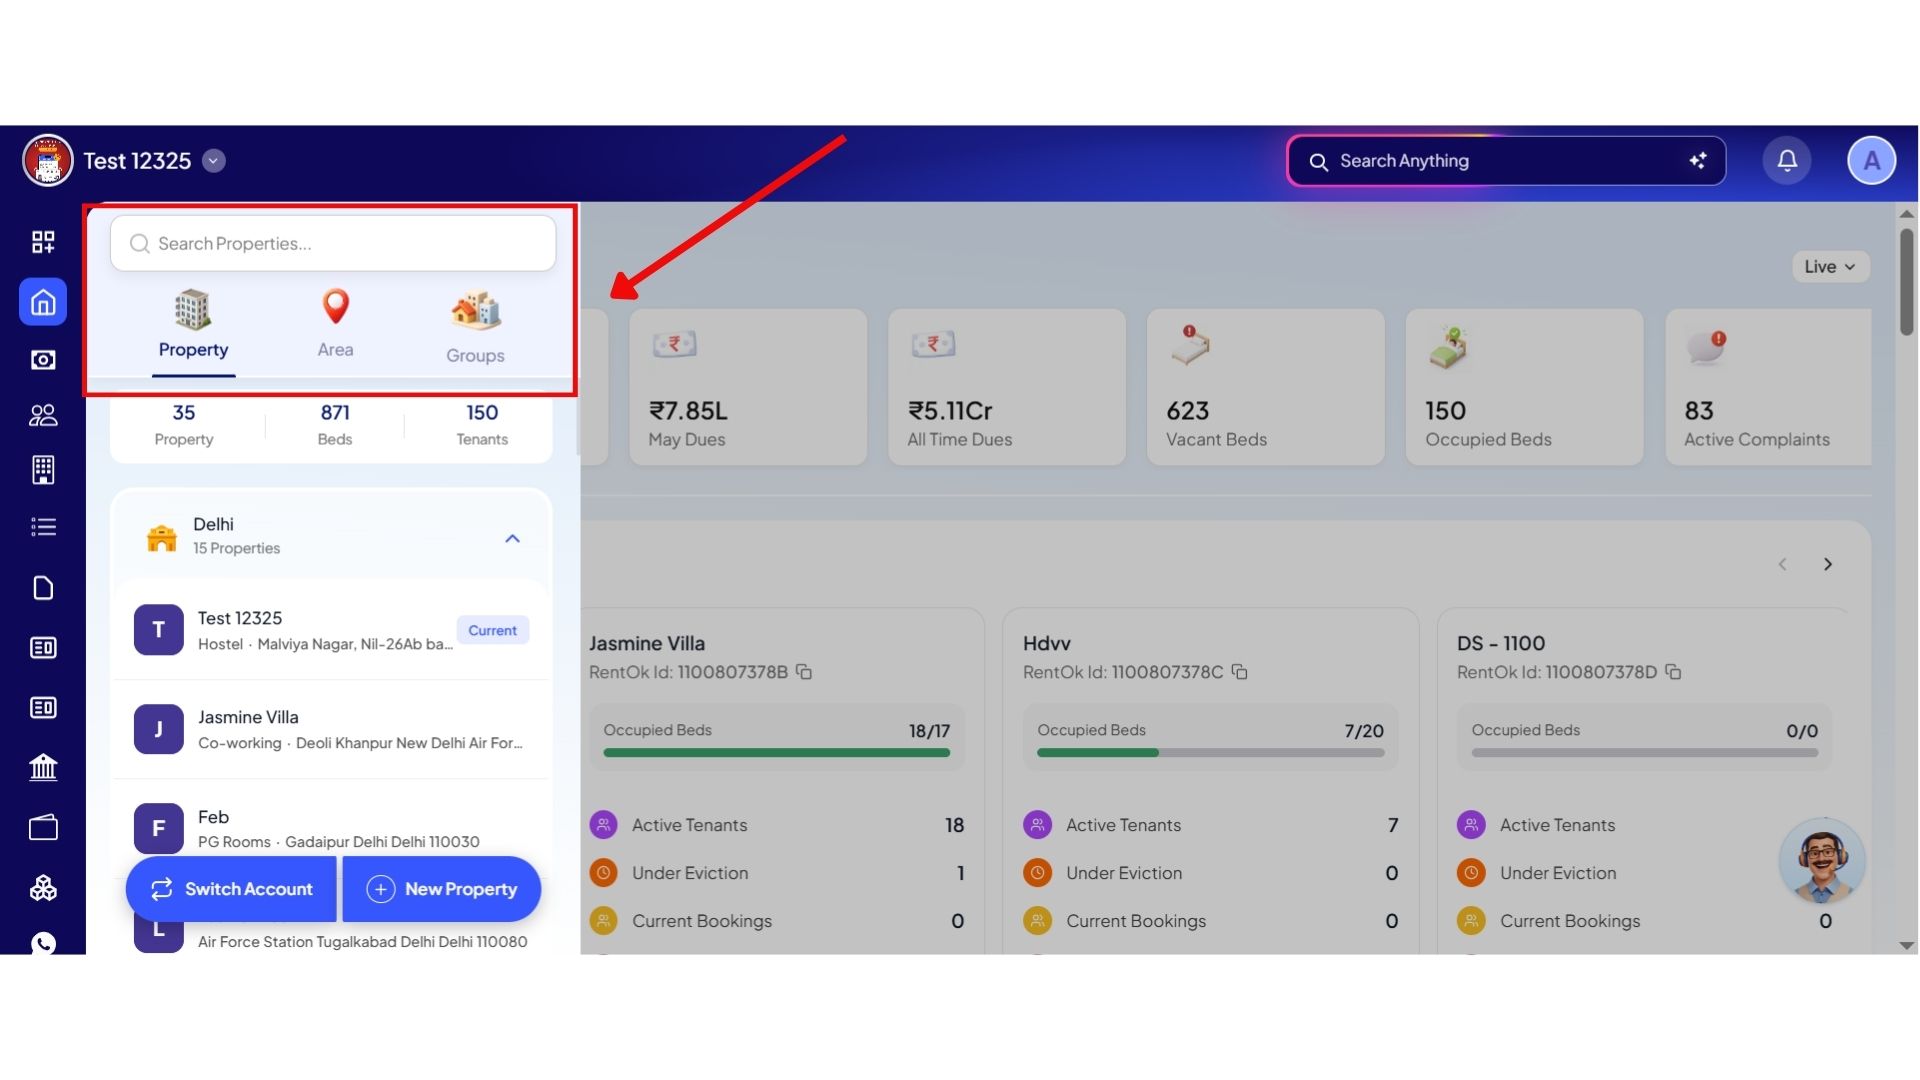
- Step 4: View Properties Individually
In the Property section, you will be able to see all your properties listed individually.
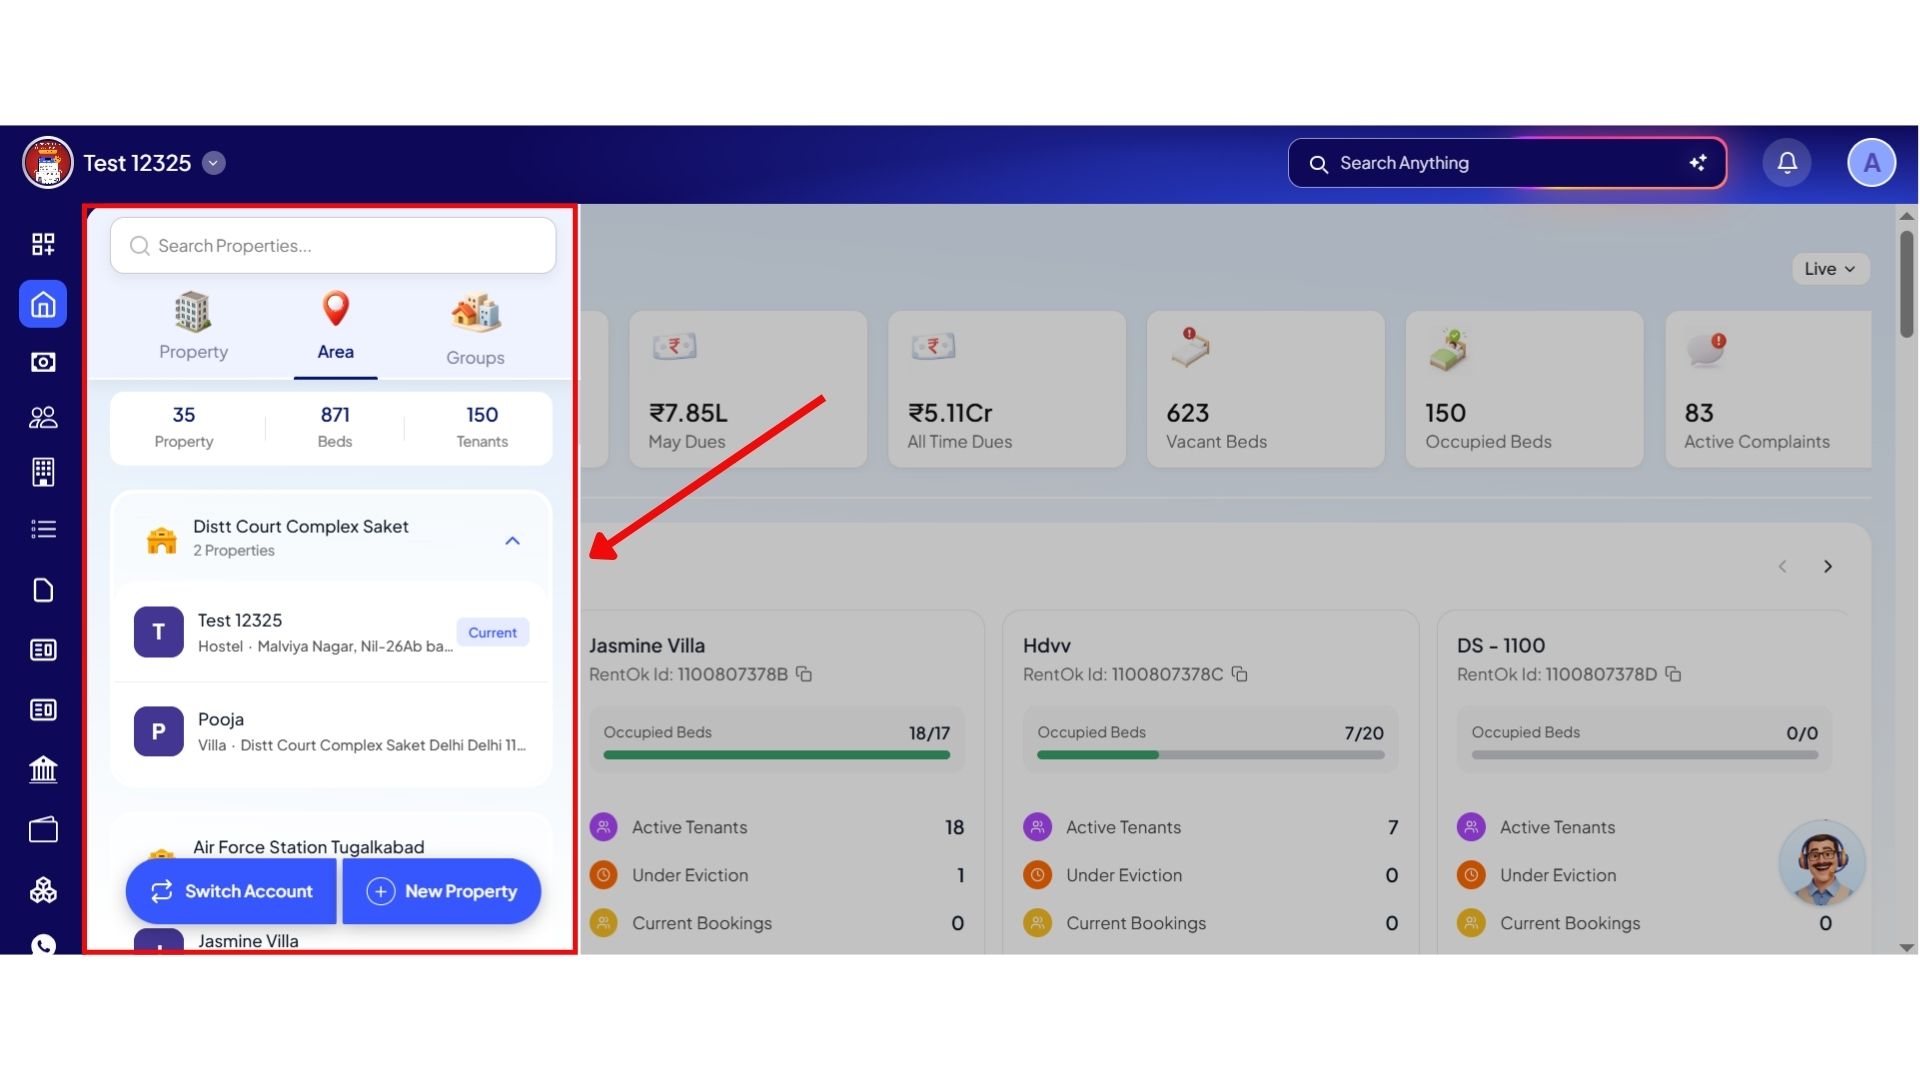
- Step 5: View Properties Area-wise
In the Area section, properties will be grouped based on their location or area.
For example, all properties from the same area will appear under one category.
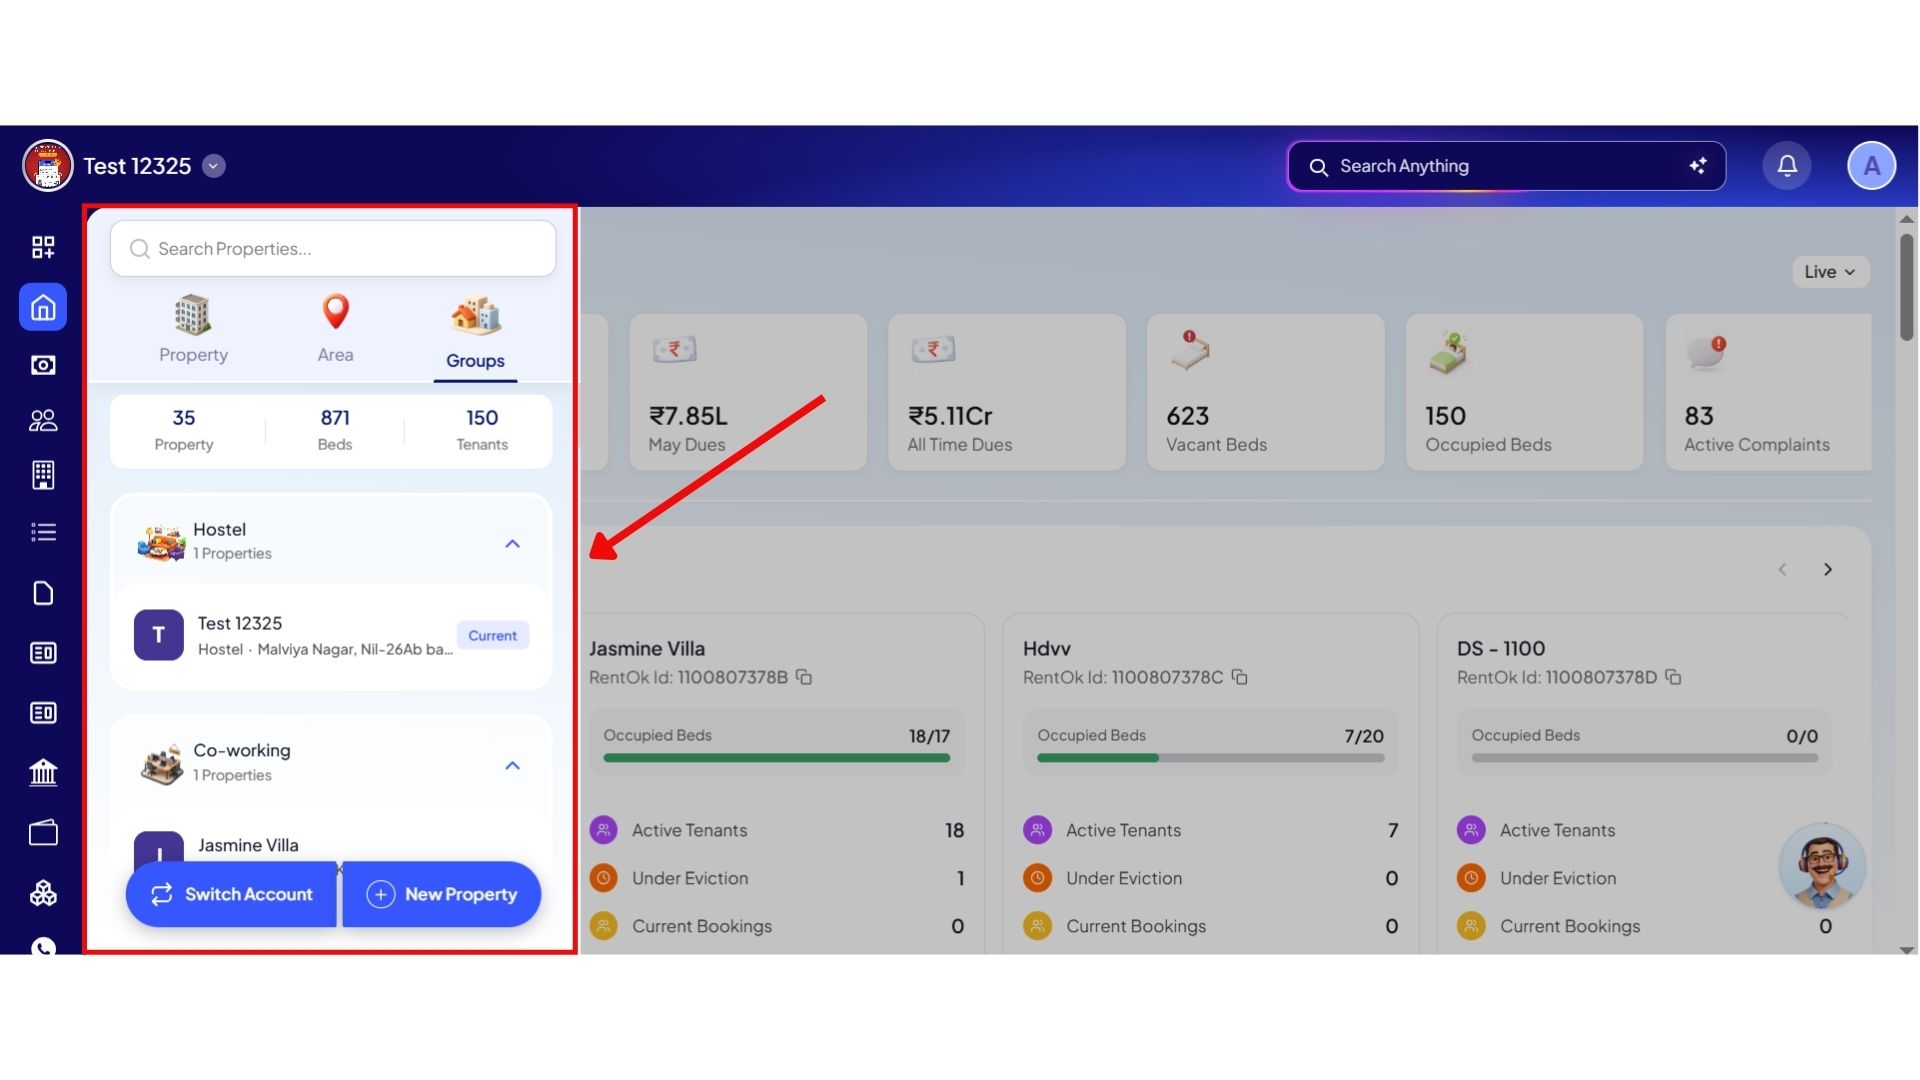
- Step 6: View Properties Group-wise
In the Groups section, properties will be categorized based on property type such as:
- PG
- Rooms
- Hostel
- Coworking
- Other categories
This helps you manage and switch between properties more efficiently based on your preferred view.
💡 Why it matters: This lets owners delegate property groups to specific cluster managers while allowing them to review regional data with a single tap.
Ab apni property ka pura overview ek hi screen par - login karte hi.
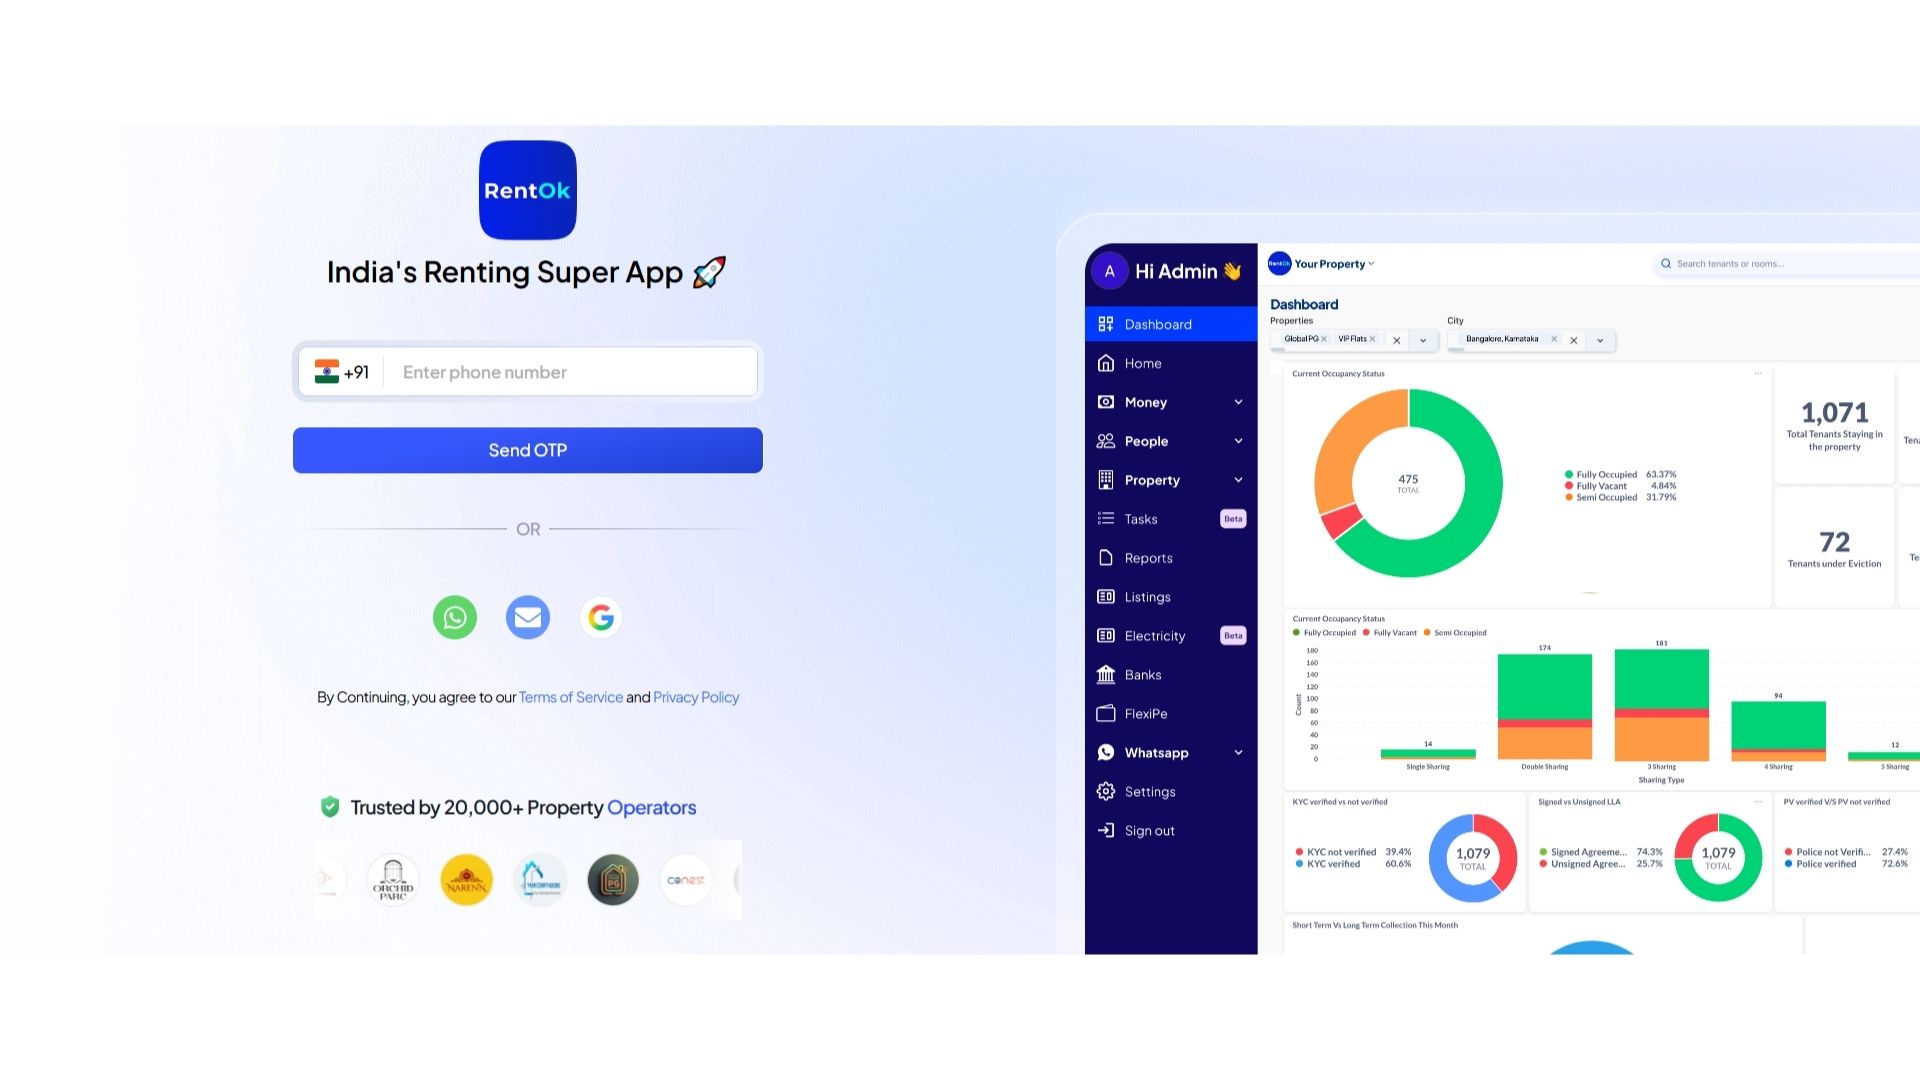
Authentication & Interface Customisation
Google Login & Sign-Up - Frictionless Account Access
We have integrated Google Authentication as a method to sign up/log in
Highlights
- One-Tap Onboarding: Create a brand new property account using any active Google ID in seconds.
- Instant Login: Bypass password prompts entirely by syncing your login credentials with your device's Google Account.
- Enterprise Security: Built using OAuth standard protocols to protect your administrative backend.
How to try
- Step 1: Open the Web App
Open the web version of the app using the link: https://manager.rentok.com/login-new.

- Step 2: Choose a Login Method
On the login screen, you can continue using different options such as:
- Phone Number
- WhatsApp Number
- Gmail/Google Account
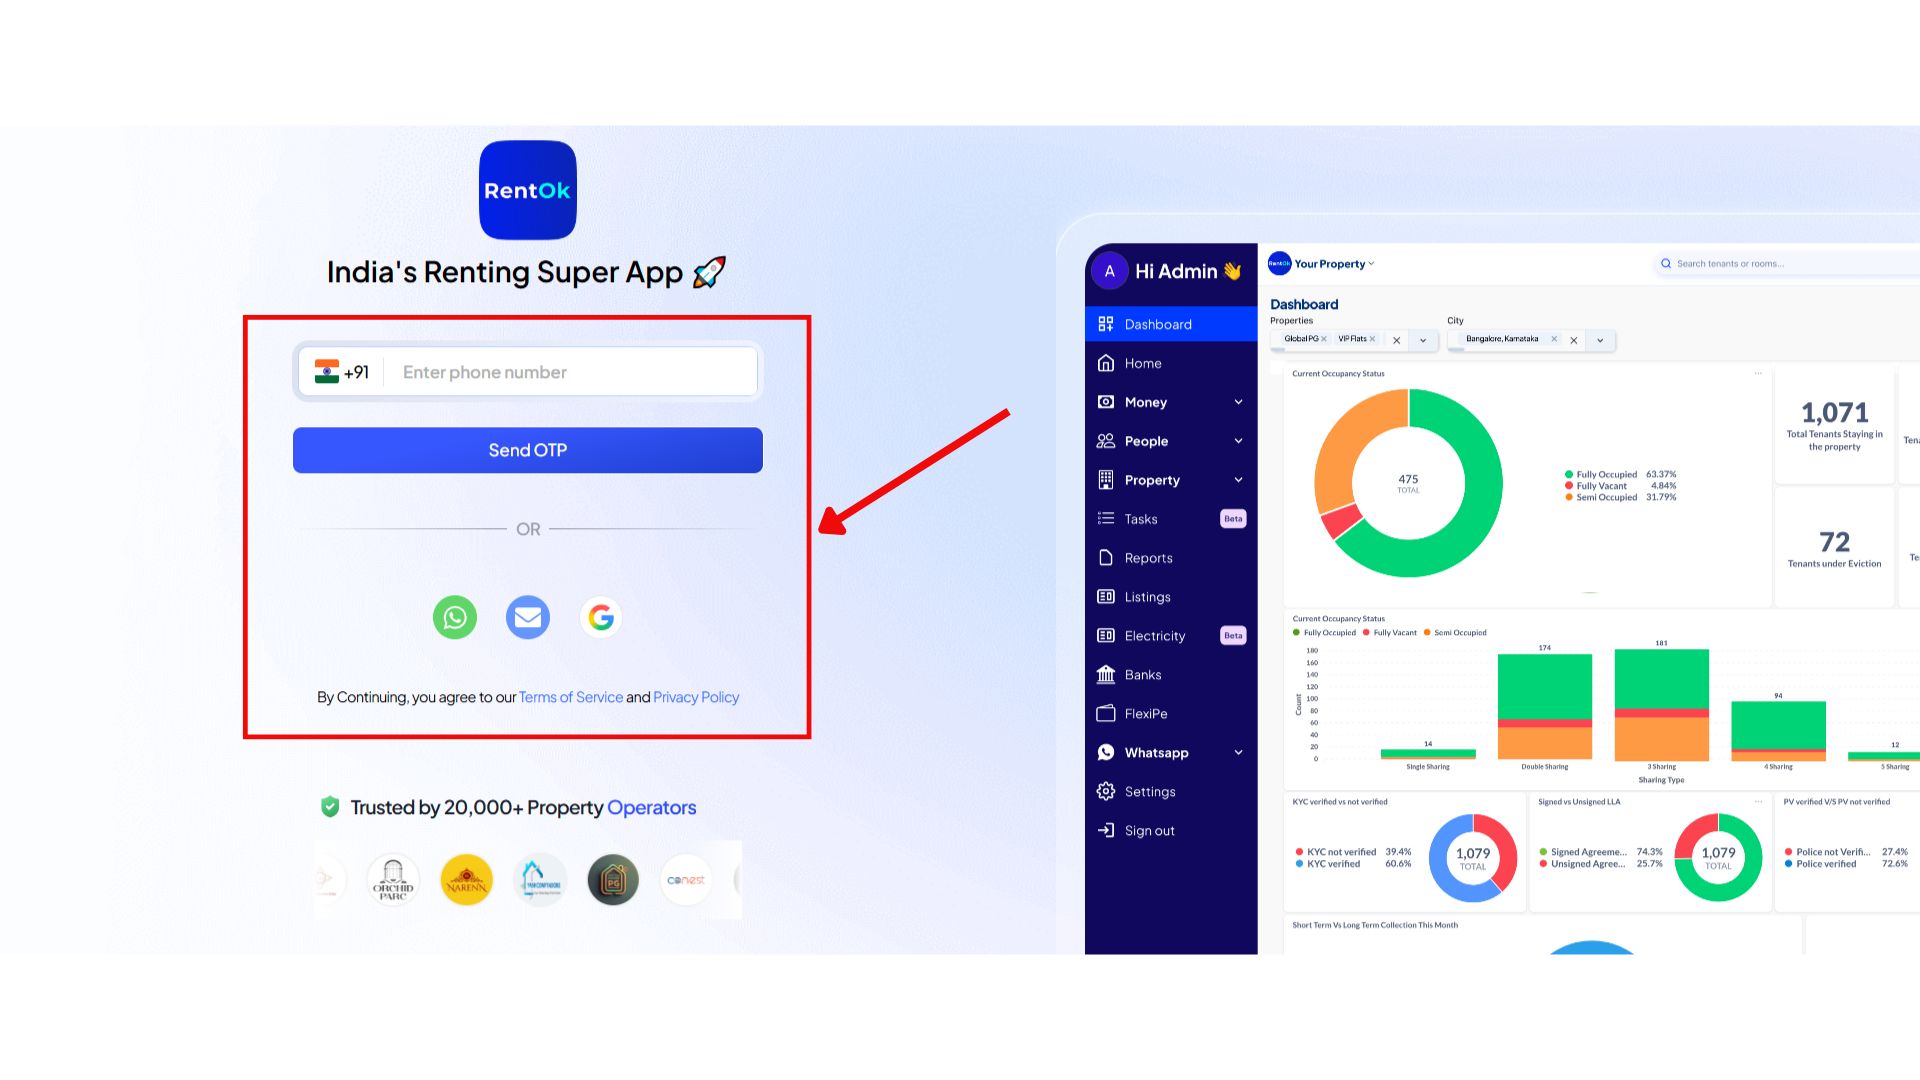
- Step 3: Enter Your Credentials
Select your preferred login method and enter the required credentials to continue.Like here we chose Gmail.


- Step 4: Access the Dashboard
Once your login or sign-up is completed successfully, you will be redirected to the Dashboard.

💡 Why it matters: This cuts down login friction for owners and staff, completely removes password recovery hassles, and adds an extra layer of account security.
A Faster, Cleaner Web Experience
Alongside the new dashboard, we have made significant UI/UX improvements across the entire web platform to make it more modern, intuitive, and faster to navigate.
See what’s new →
Highlights
- New Navigation Header: The top header on all list pages has been redesigned. It's cleaner and sticks to the top as you scroll.
**- Smarter Filters: **The filter UI has been modernized. It now shows applied filters and result counts clearly as you scroll down the page.
- Keyboard Shortcuts: You can now quickly open the search bar on any page by pressing Cmd+F (or Ctrl+F on Windows).
- Consistent Design: We've introduced a more consistent and professional design with updated colors and gradients across all sections.
💡 Why it matters: These changes make the web app feel faster and more professional. The improved navigation reduces clicks and scrolling, making your daily work more efficient, especially when managing large amounts of data.
Fixes & Polish
- New Support Hub on Web: The "Help" button on the web now opens a full support hub, allowing you to report issues, browse tutorials, and book demos directly, just like on the mobile app.
- Accurate Team Access Views: Fixed a critical bug where team members with limited property access were seeing combined occupancy data for all properties. The dashboard will now show data only for the properties they have access to.
- Clearer Data Explanations: The "info" icon on the dashboard now provides clearer, formula-based explanations for how each metric is calculated.
**- Home Page UI/UX: **Based on feedback, we will continue to refine the new home page UI for better readability and spacing.
Availability & Rollout
- Platforms: Manager Web & Manager App (Android & iOS)
- Rollout: The new dashboard and UI are live on the web. The mobile app update is rolling out this week.
- Who gets it: All properties
Need help? Message us on WhatsApp from inside the app.
Thank You
Have doubts or any feedback? Chat with us in-app (Help → send us a message). We’re building for you, and every suggestion counts